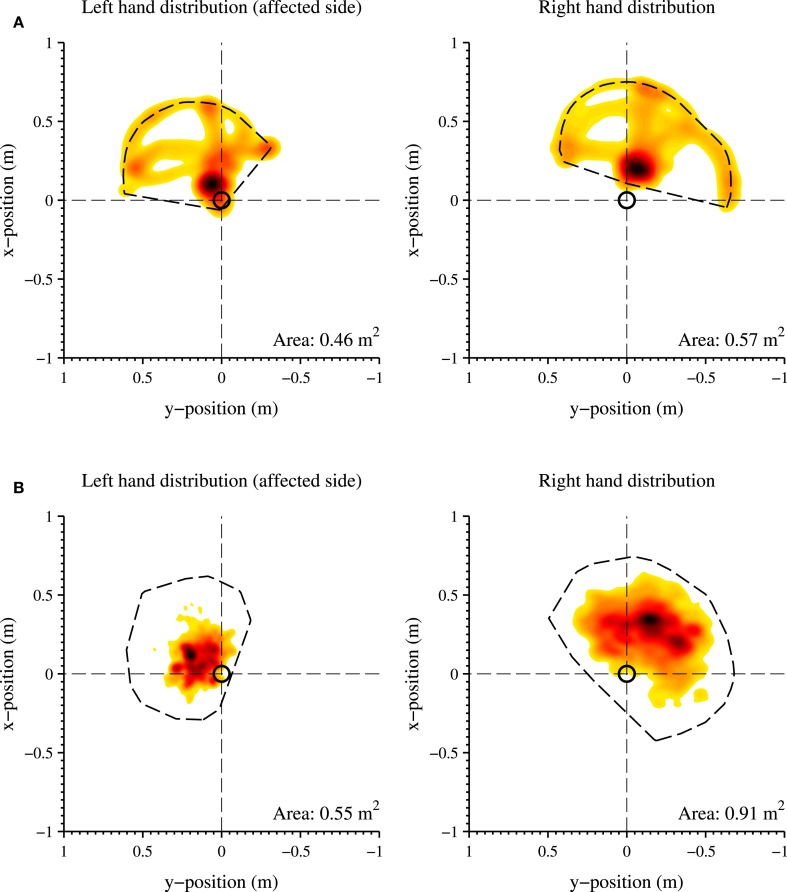
Figure 7.
Distribution of the hand positions relative to the pelvis (origin of the graph, indicated with a black circle) in the transversal plane, of the left (affected side) and right hand. (A) Structured in-clinic measurement; (B) Unstructured in-home measurement. A darker color indicates a higher frequency of a specific hand position during the measurement session. A lighter color indicates a less frequent hand position at a particular location. The total work area is contoured with a dotted line and the area size is shown in the bottom right corner of each graph. The activity report of the unstructured in-home measurement is shown in Figure 5.

