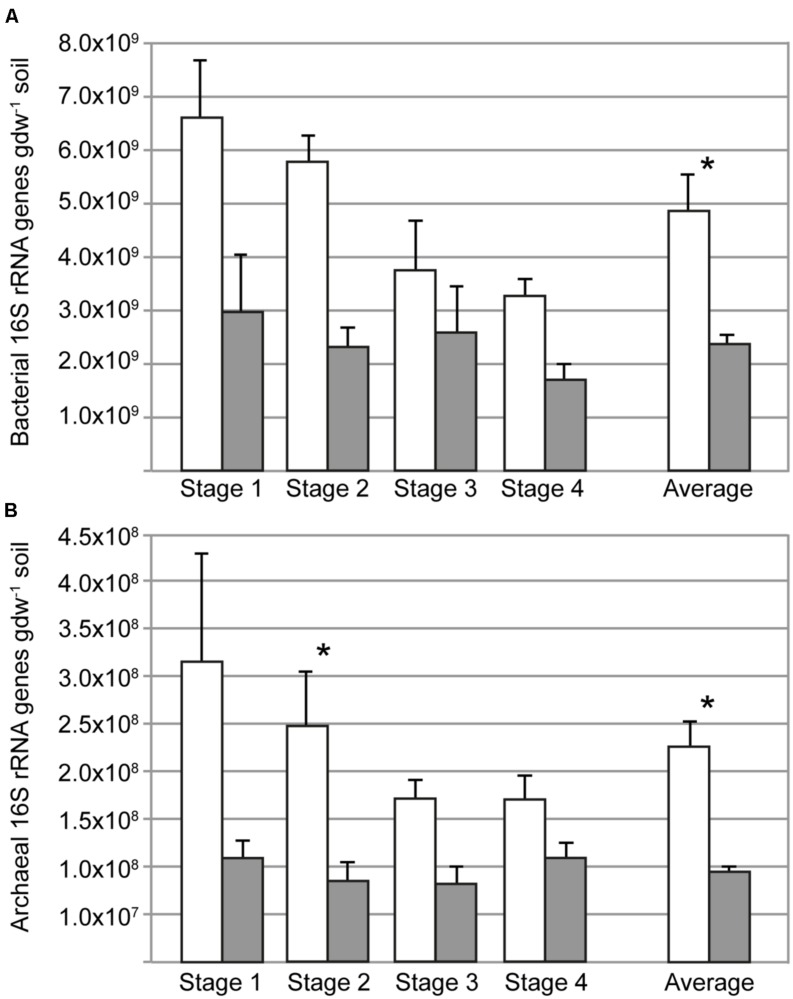
FIGURE 1.
Copy numbers of bacterial (A) and archaeal (B) 16S rRNA genes in rhizosphere (open bars) and bulk soil (filled bars) at different sampling times (days 34, 52, 62, 90); the average of the four sampling times is also shown. Asterisks indicate when the abundance in rhizosphere and bulk soil was different (ANOVA, P < 0.05). Error bars correspond to standard errors of means from replicate soil samples (n = 5).

