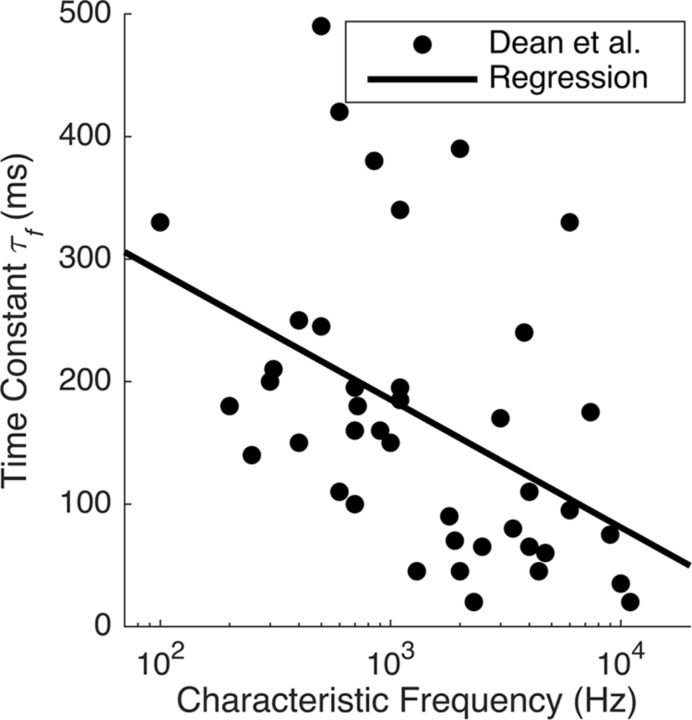
Figure 2.
Time constants of adaptation to stimulus mean observed by Dean et al. (2008) in the guinea pig IC. The x-axis shows the characteristic frequency of each IC unit, and the y-axis shows the time constant of an exponential fit to the adaptation curve for the corresponding unit. The line is our regression fit to these data (Eq. 4).

