
Figure 3.
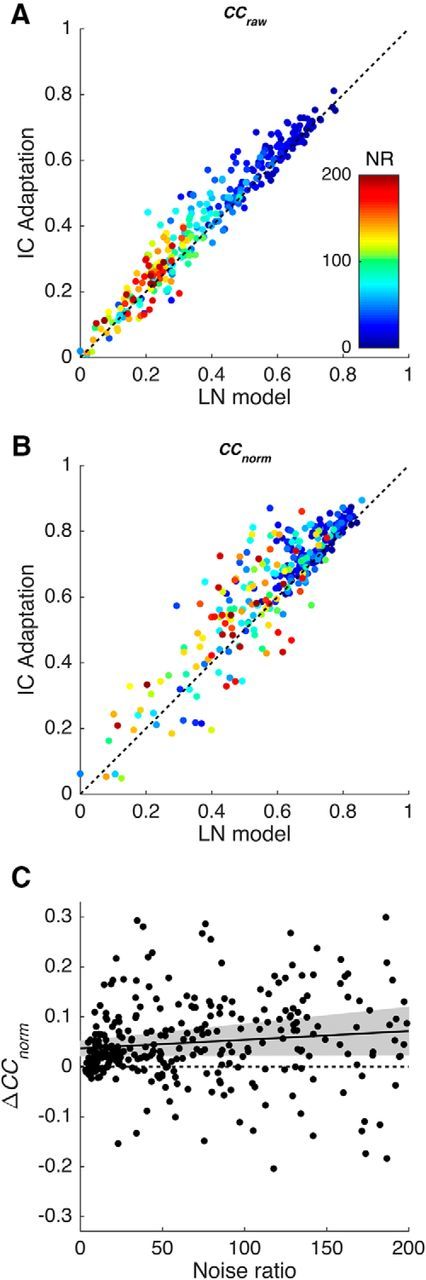
Comparison of the ability of the standard LN model and the IC Adaptation model to predict neural responses to natural sounds. A, B, Scatterplots showing the correlation coefficients between model predictions and actual neural responses (BigNat dataset). The x-axis shows performance of the standard LN model, the y-axis shows performance of the IC Adaptation model, and colors indicate the NR of each unit. A, Raw correlation coefficient CCraw. B, Normalized correlation coefficient CCnorm. C, Scatterplot showing how the difference in CCnorm between the two models varies with NR. The solid line is a linear regression, and the shaded area shows the 95% confidence intervals on the regression.