
Figure 2.
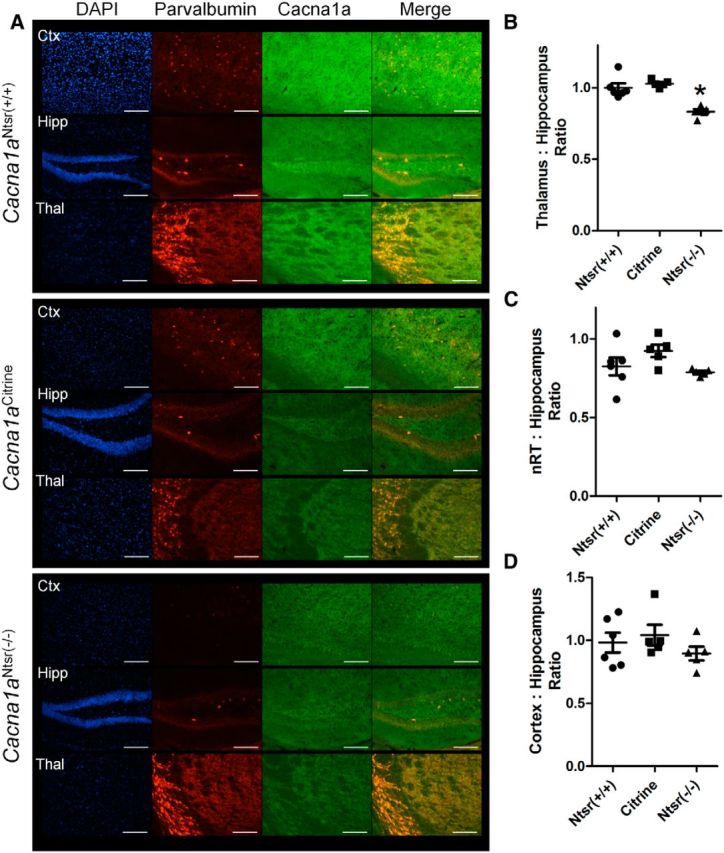
Immunostaining reveals specific knockdown of Cacna1a in ventrobasal regions of the thalamus. A, Representative staining in (top) wild-type (Cacna1aNtsr(+/+), (middle) Cacna1aCitrine, and (lower) Cacna1aNtsr(−/−)mice of cortex, hippocampus, and thalamus. TRITC-conjugated parvalbumin staining was used to identify the nRT. FITC staining marks P/Q calcium channels and DAPI marks cell nuclei. Scale bars, 100 μm. B, Densitometric ratio of the ventrobasal thalamus compared with the mossy fiber region of the hippocampus within slices of wild-type (Cacna1aNtsr(+/+), n = 6, 1.00 ± 0.03; Cacna1aCitrine, n = 5, 1.03 ± 0.01; Cacna1aNtsr(−/−), n = 5, 0.83 ± 0.02) reveal decreased P/Q immunostaining (ANOVA, *p = 0.0001). C, Densitometric ratio of the nRT compared with the mossy fiber region of the hippocampus within slices of wild-type (Cacna1aNtsr(+/+), n = 6, 0.82 ± 0.06; Cacna1aCitrine, n = 5, 0.92 ± 0.04; Cacna1aNtsr(−/−), n = 5, 0.79 ± 0.09) show no decreased P/Q immunostaining (ANOVA, p = 0.11). D, Densitometric ratio of the layer V/VI cortex compared with the mossy fiber region of the hippocampus within slices of wild-type (Cacna1aNtsr(+/+), n = 6, 0.98 ± 0.08; Cacna1aCitrine, n = 5, 1.04 ± 0.08; Cacna1aNtsr(−/−), n = 5, 0.89 ± 0.05) show no decreased P/Q immunostaining (ANOVA, p = 0.50).