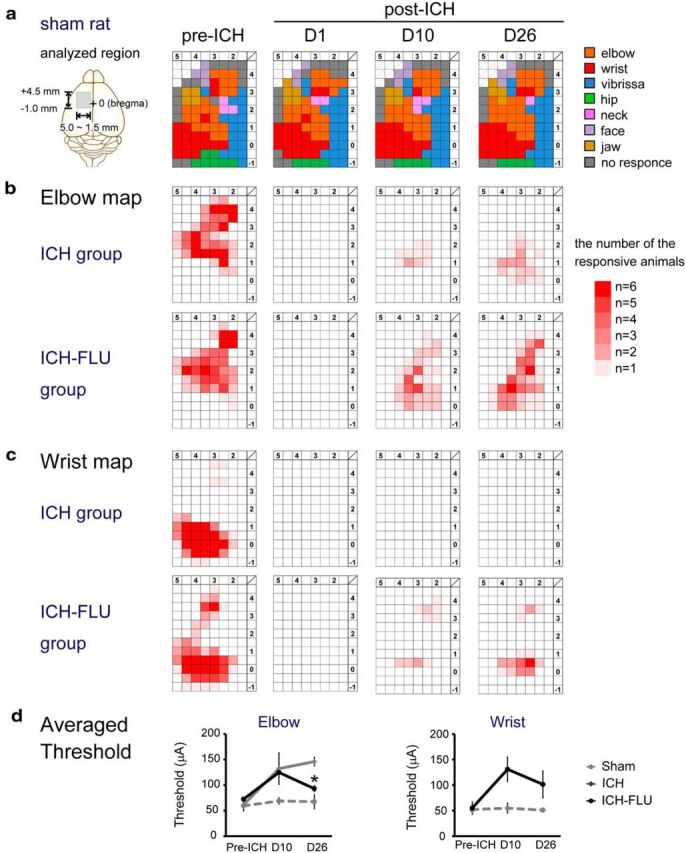
Figure 2.

Temporal changes of the forelimb representation map in the ipsilesional motor cortex. a, Typical motor representative map of the motor cortex of a sham rat. ICMS was conducted to make the representative map at 10 d before ICH and at 1, 10, and 26 d after ICH. The analyzed region is indicated with the gray rectangle in the left panel (AP: from 4.5 mm anterior to the bregma to 1.0 mm posterior to the bregma; ML: from 5.0 mm to 1.5 mm lateral to the bregma). Penetrations and stimulations were performed at 500 μm intervals. Each color represents the body part in which movements were induced at the lowest stimulus strength. b, Elbow representation map on the forelimb motor cortex. The upper four panels indicate the elbow map of the ICH group and the lower four panels indicate the map of the ICH-FLU group. Density of red shows the number of responding animals per cell (maximally n = 6). c, Wrist representation map. d, Averaged threshold of the elbow and wrist map. Elbow threshold of the ICH-FLU group was lower than that of the ICH group at 26 d after ICH. *p < 0.05 vs ICH. Values are shown as mean ± SEM.
