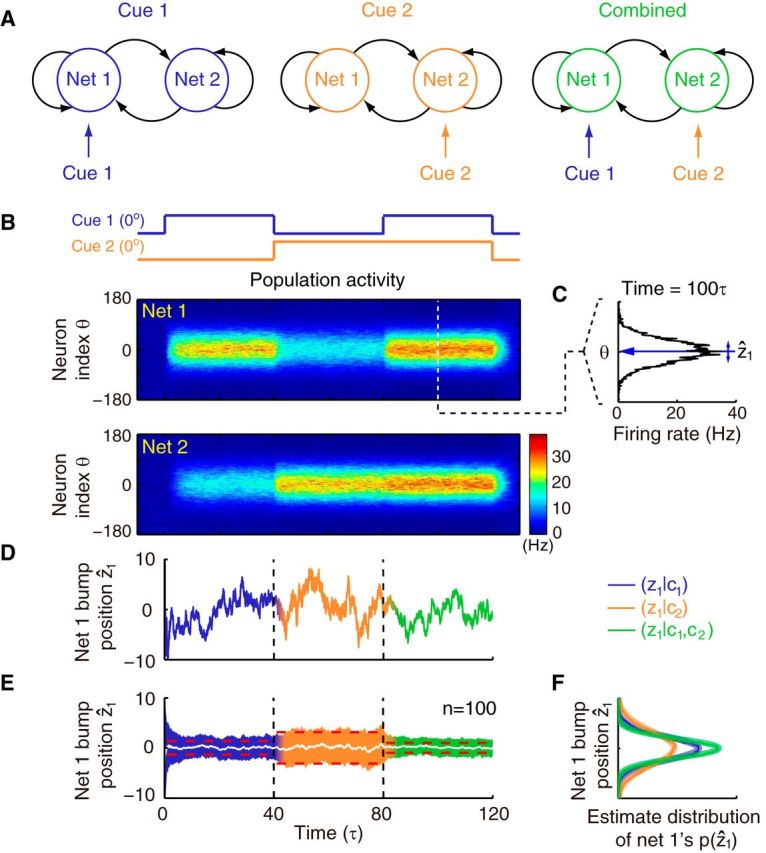
Figure 3.

Population responses and estimation results of network modules in the decentralized system. A, Illustration of the three stimulus conditions applied to the system. Cue 1 (blue) and cue 2 (orange) are first individually presented to network 1 and network 2, respectively, and then both cues are applied simultaneously (green) in the combined cue condition. B, Averaged population activities over trials of two coupled networks when presenting the stimulus conditions from A in temporal order. Both cues are congruent and static, and centered at 0°. The color encodes firing rate of the population activity. C, Snapshot of the population activity in network 1. The position of the activity bump is considered as the current estimate of the network (ẑ1). D, Estimate of network 1 (from the population activity shown in B, computed as indicated in C) fluctuates with time. E, Mean (white line) and SD (colored region) of network 1's estimates averaged over 100 trials. Red dashed lines are theoretical calculations of the SD, which fit well with the simulation results. Note that the variance of the network estimate when presenting two cues decreases compared with that when presenting single cues. Also note that the estimate based on the direct cue has less variance than that based on the indirect cue alone. F, Histograms and Gaussian fits of network 1's estimates under three stimulus conditions represent the posterior of the underlying state. Parameters: Jrc = 0.5Jc, Jrp = 0.5Jrc, and α = 0.5Um0.
