Figure 5.
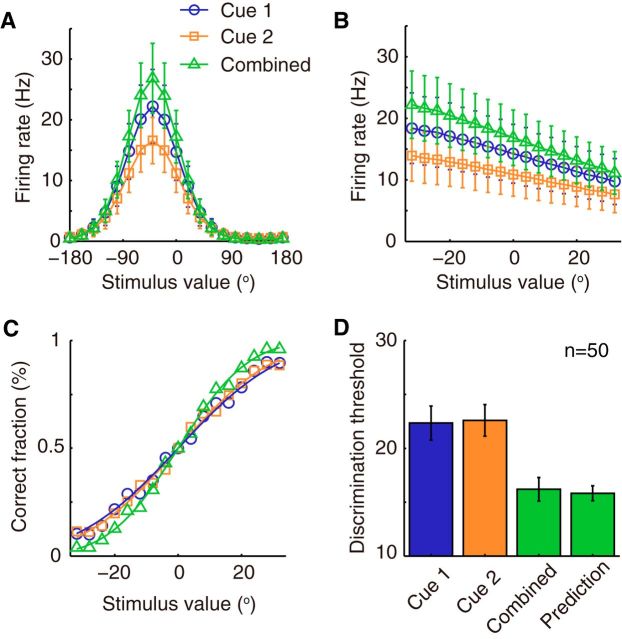
Single neurons integrate information optimally. A, Tuning curve of an example neuron in network 1 for the three stimulus conditions. The example neuron prefers −40° stimulus. Error bar indicates the SD of firing rate across trials. B, Responses of the example neuron in a narrow range of stimulus values for the three stimulus conditions. The responses in this small stimulus range are used to perform ROC analysis to estimate the neurometric functions. C, Neurometric functions of the example neuron, which denotes the correct fraction of judging the stimulus to be larger than 0°. Smooth lines show the cumulative Gaussian fit of the neurometric functions. D, Average neuronal discrimination thresholds of the example neuron in three stimulus conditions compared with the Bayesian prediction (Eq. 30). The actual neuronal discrimination thresholds in the case of combined cues are comparable with the Bayesian prediction (p = 0.044, n = 50, unpaired t test). Parameters: Jrc = 0.5Jc, Jrp ∈ 0.5Jrc, α1 = 0.4Um0, α2 = 0.9Um0.

