
Figure 8.
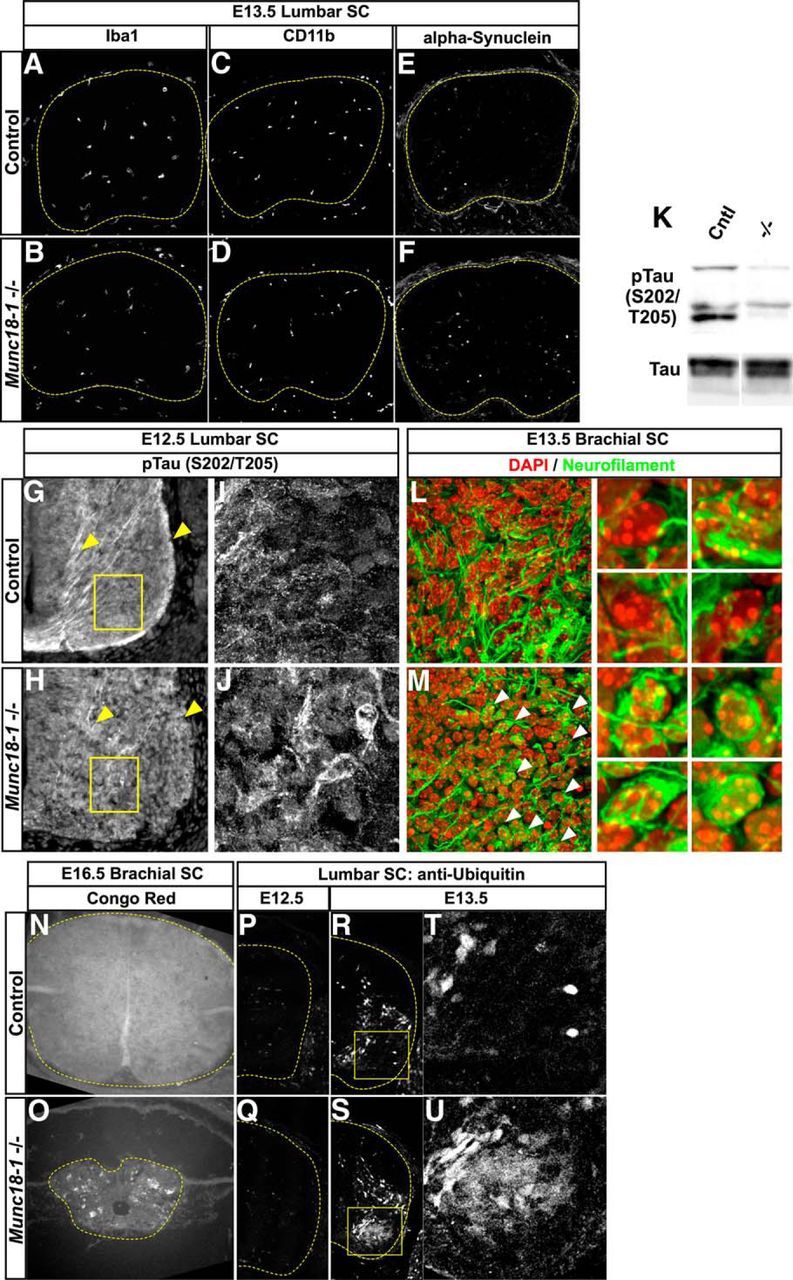
Neurodegenerative markers in Munc18-1−/− mice. Immunostaining for the microglial markers Iba1 (A, B) and CD11b (C, D) reveal no differences between control and Munc18-1−/− mice. Alpha synuclein expression also appears similar between control and Munc18-1−/− mice (E, F). Immunostaining for pTau expression in Munc18-1−/− mice at E12.5 reveals accumulations within neurons in the spinal cord that are not present in WT (G–J) and a reduction of expression in axons (G, H, arrowheads). Western blotting reveals a reduction in pTau, but not total Tau, levels in lysates from E13.5 Munc18-1−/− spinal cords (K). Immunostaining at E13.5 reveals multiple aggregations of neurofilament in Munc18-1−/− animals (M, arrowheads) that are not present in controls (L). Congo Red staining reveals UV-emitting accumulations of signal in Munc18-1−/− degenerating spinal cords at E16.5 that are not present in controls (N, O). Immunostaining for ubiquitinated proteins at E12.5 reveals no differences between control and Munc18-1−/− animals (P, Q); however, at E13.5, there is an increase in ubiquitin staining in motor neurons of Munc18-1−/− mice (R–U).