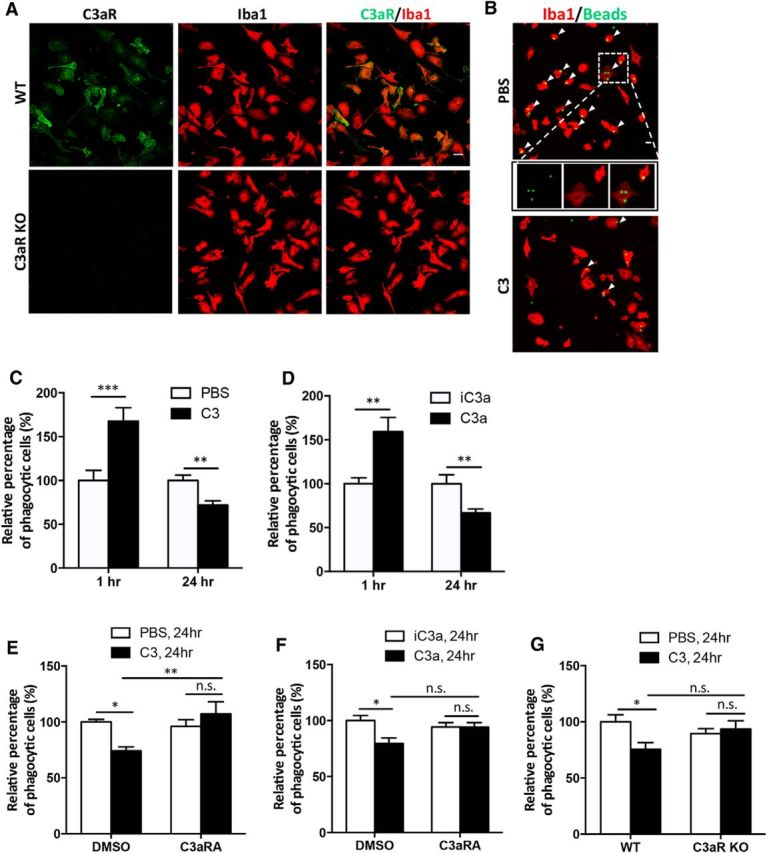
Figure 4.

C3 and C3aR signaling modulates microglial phagocytosis in vitro. A, Double immunostaining for C3aR and Iba1 in WT and C3aR KO primary microglia. B, Representative images of fluorescent bead uptake in primary WT microglial cultures treated with PBS or 10 μg/ml C3 for 24 h. Microglia are labeled with an anti-Iba1 antibody in red, and beads are labeled with green fluorescence. Examples of phagocytic Iba1+ cells with internalized beads are marked by arrowheads, with one PBS-treated cell (inset) shown in higher-magnification views. C, Relative percentage of phagocytic microglia following 1 or 24 h of vehicle (PBS) or C3 (10 μg/ml) treatment. D, Relative percentage of phagocytic microglia following 1 or 24 h of control (iC3a) or C3a (100 nm) treatment. E, Relative percentage of phagocytic microglia after 24 h PBS or C3 treatment in the presence of 10 μm C3aRA or DMSO vehicle. F, Relative percentage of phagocytic microglia after 24 h iC3a or C3a treatment in the presence of 10 μm C3aRA or DMSO vehicle. G, Relative percentage of phagocytic cells in WT or C3aR KO microglia treated with PBS or C3 for 24 h. N = 12 random fields for each data point; each field contained >100 cells. Scale bars: 20 μm. *p ≤ 0.05; **p ≤ 0.01; ***p ≤ 0.01 (C, D, Student's t test; E–G, two-way ANOVA followed by Bonferroni's post hoc analysis; n.s., nonsignificant.
