Figure 6.

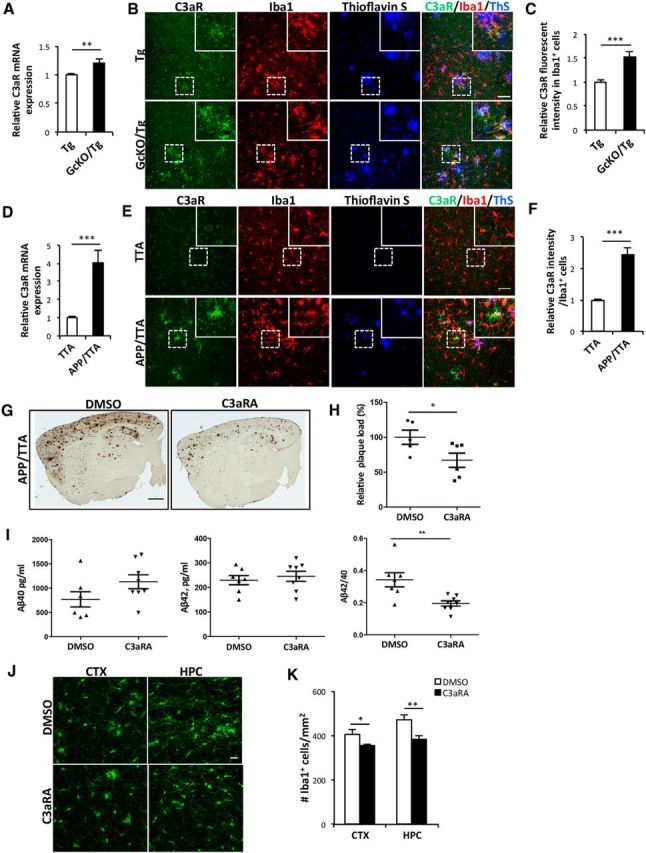
C3aR inhibition ameliorates amyloid pathology. A, qPCR measurement of C3aR mRNA in Tg and GcKO/Tg mouse brains. N = 6/group. B, Representative double immunostaining for C3aR and Iba1 with amyloid plaques labeled by Thioflavin S in cortical sections from 18-month-old Tg and GcKO/Tg mice. C, Quantification of relative C3aR immunofluorescence intensity in Iba1+ cells from Tg and GcKO/Tg mice brain sections. N = 40 cells (Tg); N = 35 (GcKO/Tg). Random sections were selected for analysis from three animals per genotype. D, qPCR measurement of C3aR mRNA in TTA and APP/TTA mouse brains. N = 6 animals (TTA); N = 7 (APP/TTA). E, Representative double immunostaining for C3aR and Iba1 with amyloid plaque labeled by Thioflavin S in cortical sections from 8-month-old TTA and APP/TTA mice. F, Quantification of relative C3aR immunofluorescence intensity in Iba1+ cells from TTA and APP/TTA brain sections. N = 35 cells (TTA); N = 28 (APP/TTA). Random sections were selected for analysis from three animals per genotype. G, Representative immunostaining of amyloid plaques in APP/TTA mice treated with vehicle (DMSO) or 1 mg/kg C3aRA. H, Quantification of plaque load in the forebrain of DMSO- or C3aRA-treated animals. N = 6 animals/genotype/treatment, 2–4 sections per mouse. I, Levels of RIPA-extracted Aβ40 and Aβ42 and the Aβ42/40 ratio in DMSO- or C3aRA-treated APP/TTA mice. N = 6 animals/genotype/treatment. J, Representative Iba1 immunostaining in the CTX and HPC of APP/TTA animals treated with DMSO or C3aRA. K, Number of Iba1+ cells in the CTX and HPC of APP/TTA animals treated with DMSO or C3aRA. N = 11 sections (CTX, APP/TTA, DMSO); N = 12 (CTX, APP/TTA, C3aRA); N = 12 (HPC, APP/TTA, DMSO); N = 16 (CTX, APP/TTA, C3aRA). Scale bars: B, E, 50 μm; G, 1 mm; J, 20 μm. *p ≤ 0.05; **p ≤ 0.01; ***p ≤ 0.001 (Student's t test).
