Figure 1.
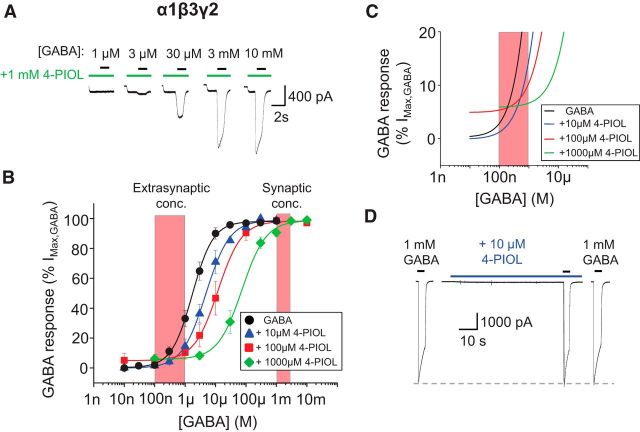
Functional properties of recombinant α1β3γ2 GABAA receptors activated by 4-PIOL. A, Representative whole-cell current traces elicited by GABA in the presence of preapplied 4-PIOL (1 mm), for α1β3γ2-expressing HEK293 cells. In this, and subsequent figures, the horizontal bars indicate the duration of drug applications; here representing GABA (black) and 4-PIOL (green) applications. B, Mean peak GABA concentration–response curves constructed in the absence (●), or presence of 10 μm (▴), 100 μm (■) or 1000 μm (♦) 4-PIOL (n = 4–13; mean ± SEM). The peak response to each concentration of GABA was measured in relation to the holding current before 4-PIOL preapplication, and each dataset was normalized to the maximum response achieved by a saturating concentration of GABA, in the absence of 4-PIOL. The normalized concentration–response curves were fitted using a modified Hill equation (black and colored lines), to account for the elevated curve minima induced by 4-PIOL. The red hatched boxes represent concentrations of GABA proposed to exist at extrasynaptic (100 nm–1 μm) and synaptic sites (>1 mm). C, An expanded part of the GABA concentration–response curves presented in B. Note the elevated curve minima induced by 100 and 1000 μm 4-PIOL. D, Example whole-cell current traces elicited by 1 mm GABA in the absence, or presence of preapplied 10 μm 4-PIOL (blue bar).

