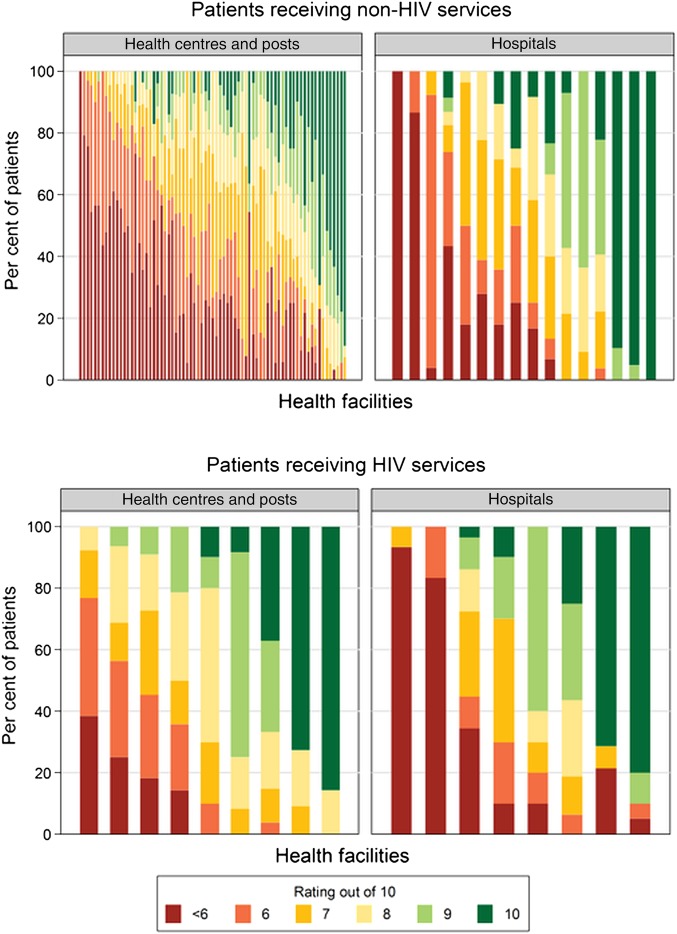
Figure 1.
Composition of overall ratings, at facilities with at least 10 surveys conducted with patients of the specified visit type. Note: each vertical bar represents a health facility. Within each bar, each colour shows the proportion of patients interviewed at that facility that gave the rating associated with that colour in the legend.

