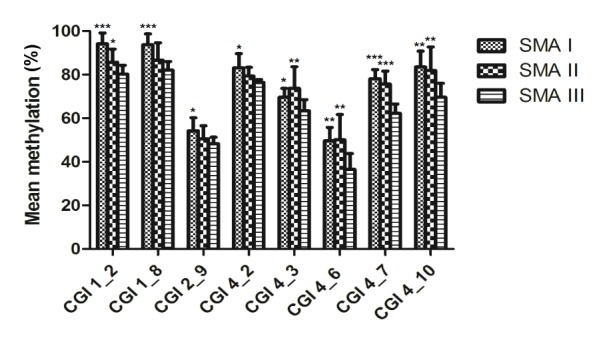
Fig. 3.

Comparison of SMN2 methylation levels by SMA types
Eight CpG units had different methylation frequencies in type I or II compared with type III SMA patients (* P<0.05, ** P<0.01, and *** P<0.001 significantly differ). The bar graph depicts the mean methylation levels (±SD) of each CpG unit within the respective CGIs and each CpG unit includes one to four CpGs. The CpG unit corresponding dinucleotide position is as follows: CGI 1_2: nt −871, CGI 1_8: nt −735, CGI 2_9:nt −290/−288/−285, CGI 4_2: nt +890, CGI 4_3: nt +938, CGI 4_6: nt +988, CGI 4_7: nt +999, and CGI 4_10: nt +1064
