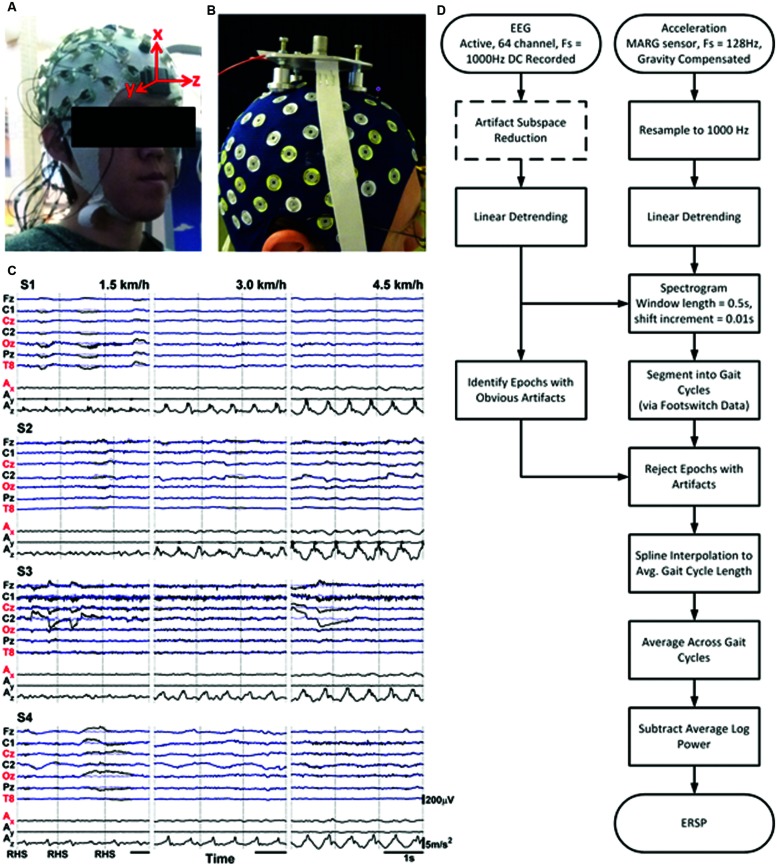
FIGURE 1.
(A) Photos of subject and experimental setup showing active EEG cap and triaxial MARG inertial sensor mounted on the forehead (left) and of (B) subject and experimental setup from similar protocol in Castermans et al. (2014), reproduced here with permissions from the author and publisher. (C) Sample raw EEG and Accelerometer data for three gait cycles for all four subjects and all three speeds. The x-, y-, and z-axes for the accelerometer represent the vertical, mediolateral, and anterior–posterior directions respectively. Traces with red labels indicate channels chosen for further analyses. Blue traces are EEG channels after processing with ASR. Vertical black lines indicate onset of Right Heel Strikes (RHS). (D) Flowchart illustrating steps and processes from recording signals to generating ERSPs.

