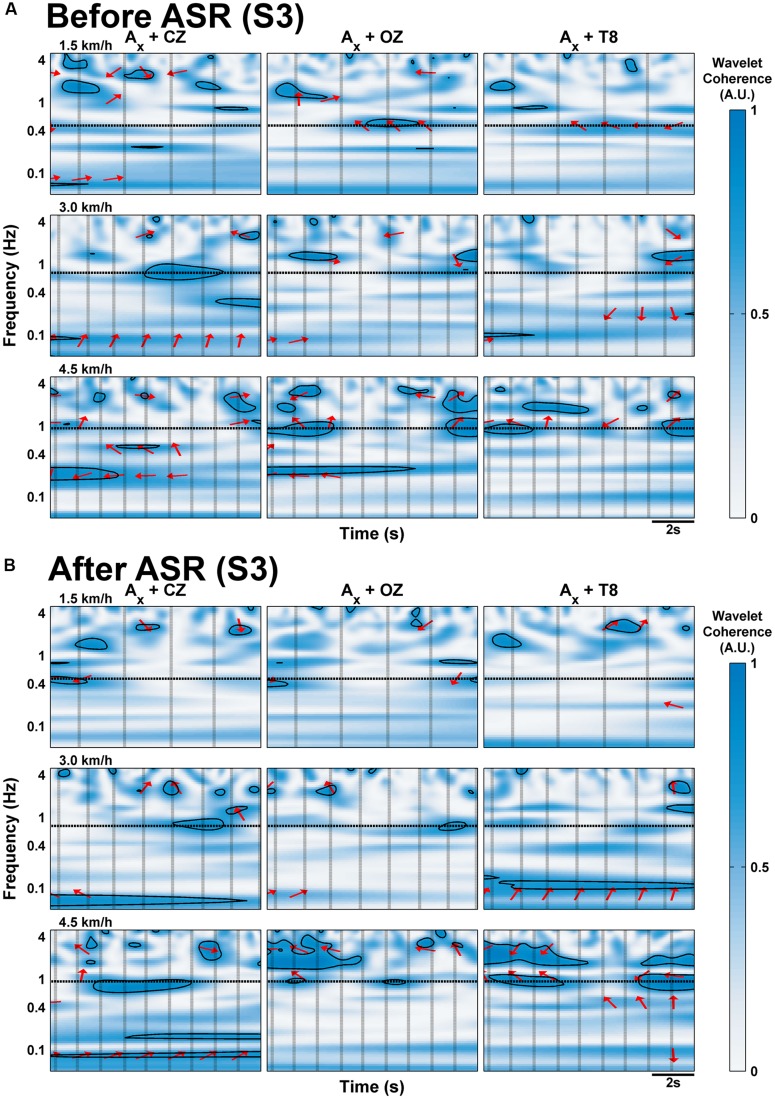
FIGURE 4.
Wavelet coherence of EEG channels with x-axis of acceleration for sample 10 s of walking data for subject S3 at each speed, (A) before and (B) after processing with Artifact Subspace Reduction. Frequency is scaled logarithmically on the y-axis and is limited to the delta band range of EEG (up to 4 Hz). Vertical black lines indicate onset of RHS; horizontal black lines indicate the frequency of stepping. The arrows indicate the relative phase relationship (in-phase pointing right, anti-phase pointing left, and EEG leading acceleration by 90° pointing straight down), and are only shown for regions with coherence greater than 0.5. Thick black contour lines indicate regions are significant against red noise at the 5% level.

