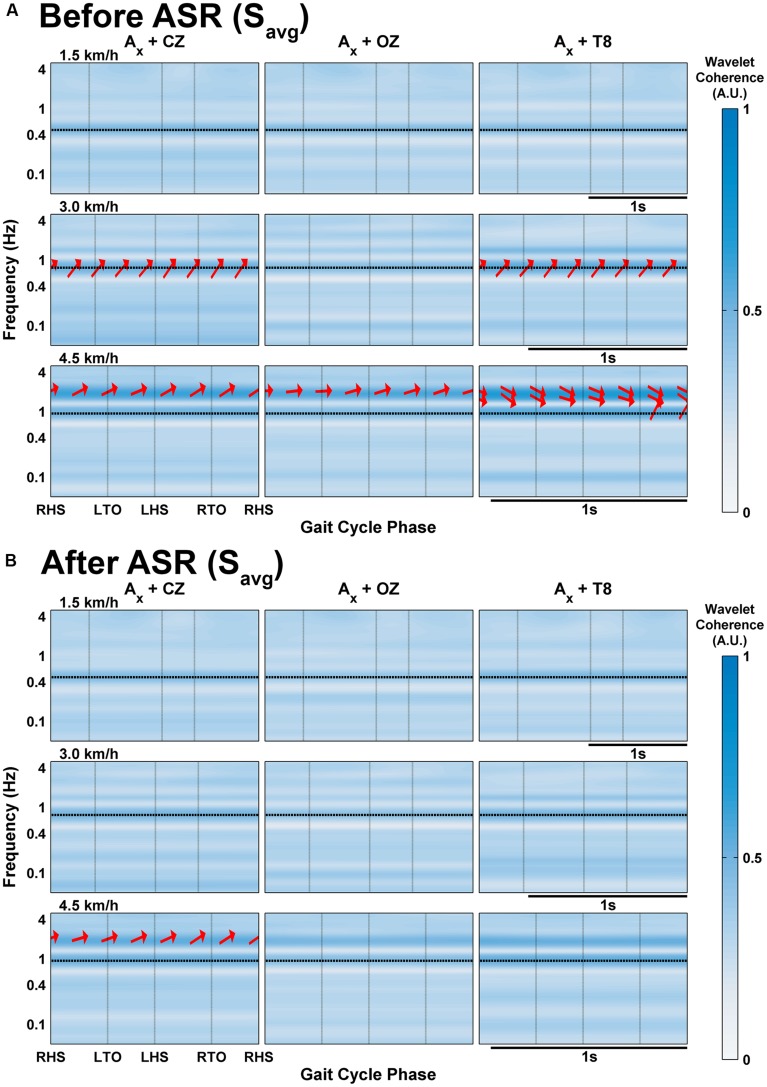
FIGURE 5.
Wavelet coherence of delta band EEG with x-axis of acceleration averaged across all subjects’ gait cycles at each speed (A) before and (B) after processing with Artifact Subspace Reduction. Vertical black lines indicate onset of gait cycle phase; horizontal black lines indicate the frequency of stepping. The arrows indicate the relative phase relationship (in-phase pointing right, anti-phase pointing left, and EEG leading acceleration by 90° pointing straight down), and are only shown for regions with coherence greater than 0.5.

