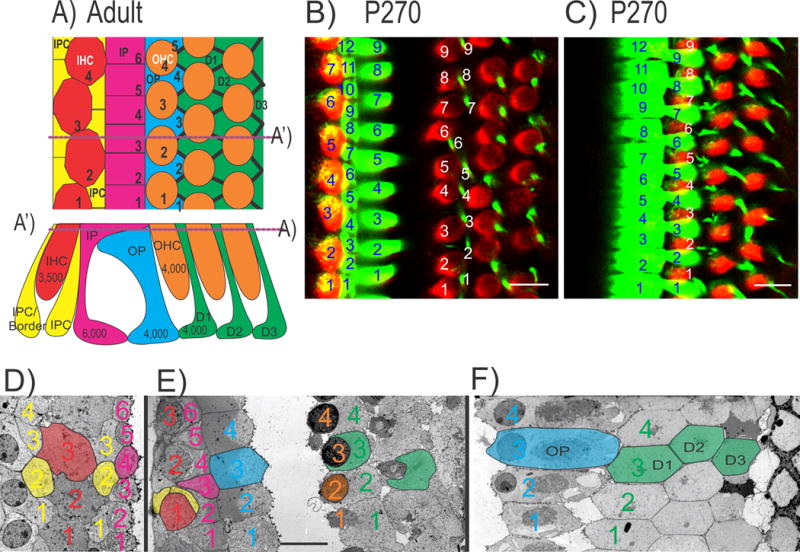
Figure 1.

The diagram shows the adult mosaic of hair cells (HCs) and supporting cells of the organ of Corti (OC; a) with numbers of cell types inserted for the adult human cochlea. Dotted line in (a) indicates the section plane in (a’) and vice versa. The total number of inner hair cells (IHCs) to inner pillar (IP) cells is almost a 1:2 ratio whereas each of the three rows of outer hair cells (OHCs) to outer pillar (OP) and Deiters’ cells (D1, D2, D3) is a 1:1 ratio (a–f). The ratio of IP to OP cells (4:3) indicates numerical differences between the medial and lateral compartments possibly related to distinct quantitative regulatory mechanisms. The distribution of HCs and supporting cells in the mouse cochlea show a similar pattern revealed by immunohistochemistry of Myo7a and Tubulin at P270 (b, c). The ratio of IHCs to IP cells is nearly 2:3 but the ratio of OHCs to OP/Deiters’ cells is 1:1 with an IP to OP cells ratio of 4:3 (b, c). The lower row shows transmission electron microscopy (TEM) sections taken parallel to the reticular lamina of an adult guinea pig through the inner compartment (d), the inner and outer compartment (e) and only the outer compartment (f). Colored numbers identify HCs and supporting cells with the same color code as in the drawing in (a). Note that IP cells are most abundant (6 in d, e). There are four inner phalangeal cells (IPC, sometimes also referred to as border cells) medial (yellow 1–4 in d) and 3.5 inner phalangeal cells lateral to the 3.5 IHCs, suggesting a ratio of nearly 2:1 between IPCs and IHCs. IHCs are in broad contact with each other at this section plane but are only in limited contact with IP cells. Note that the outer compartment consists of a mosaic of 4 OP cells, 4 OHCs and 4 Deiters’ cells (g) per row. IP cells are the most numerous cells forming a single row with no obvious ratio to other cell types of the OC. Scale bar represents 10 μm in b–f. Modified after [56,88,116].
