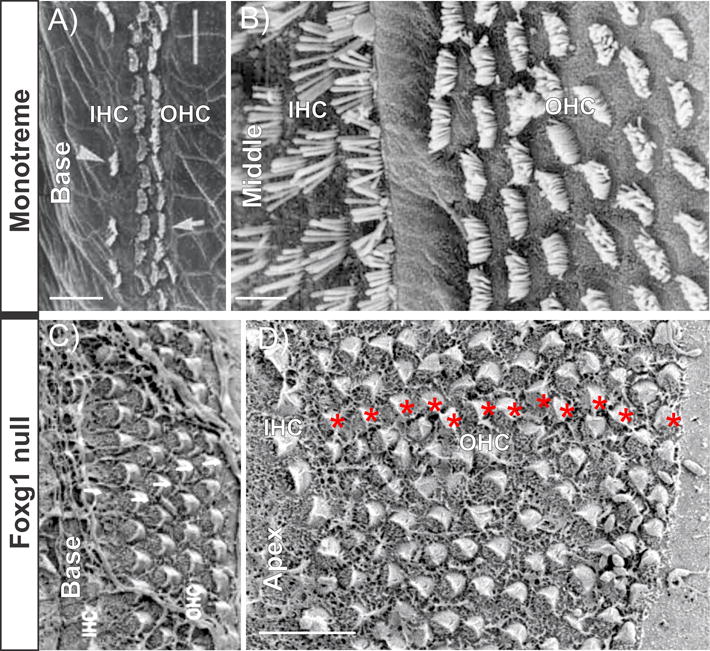
Figure 2.

Scanning electron microscopy (SEM) images show the similarity of HC distribution in a monotreme (a, b) and Foxg1 null mouse cochlea (c, d). Monotreme cochlea has multiple rows of both IHCs and OHCs in the apex (b). However, the base of the monotreme cochlea has only one row of IHCs and two rows of OHCs (a). The Foxg1 null mouse cochlea has up to 12 rows of OHCs in the apex (red * in d) but HC distribution remains near normal in the base (c). Both monotreme and Foxg1 null mouse have a much shortened cochlea. Absence of convergent extension of the growing cochlear duct can affect the apical HCs without having much effect on the base whereas reduced proliferation always leads to shortened OC. Scale bar represents 10 μm. Modified after [33,37].
