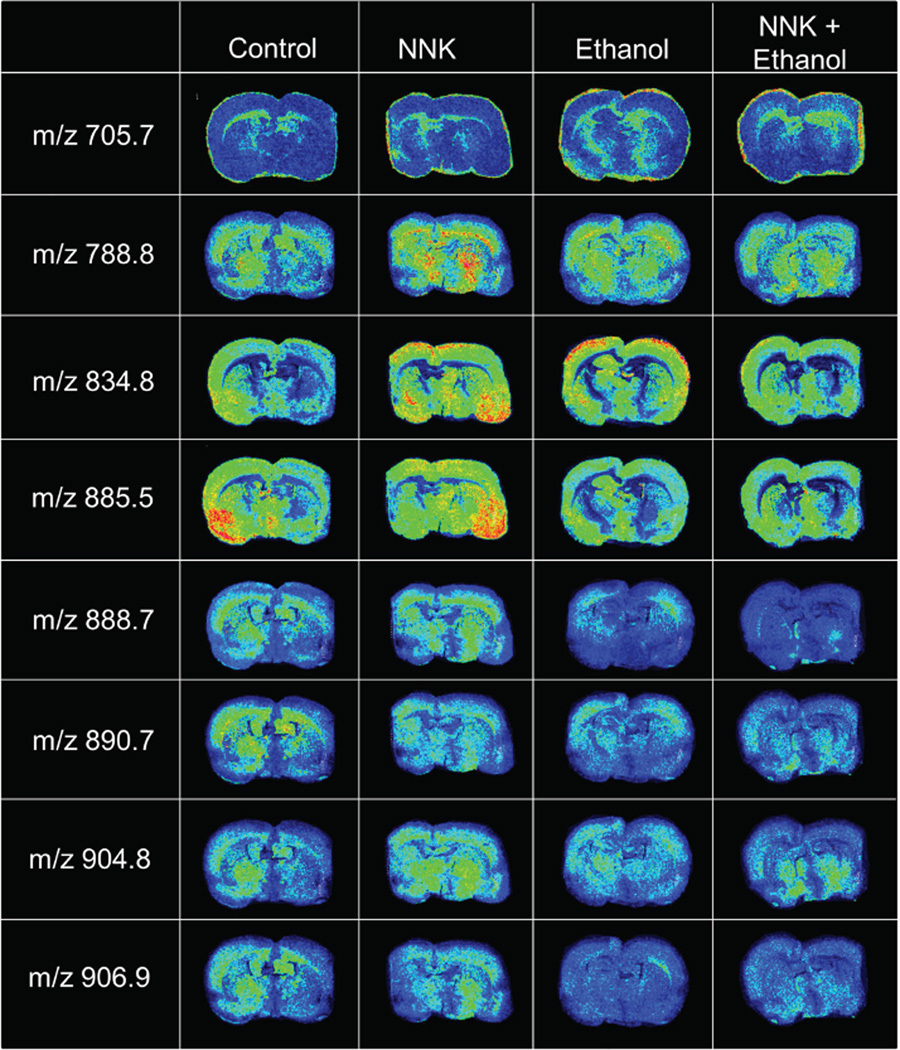
Figure 4. Effects of NNK, ethanol, and ethanol+NNK exposures on WM phospholipid and sulfatide ion profiles.
Representative MALDI-IMS results showing regional distributions and levels of 8 distinct m/z phosphotidylserine (PS), phosphatidylinositol (PI), or sulfatide (ST) species in coronal sections of brain from control, NNK-treated, ethanol-exposed, or ethanol+NNK-exposed rats. Images were obtained in the negative ion mode. See Table 1 for lipid ion identification by MS/MS.

