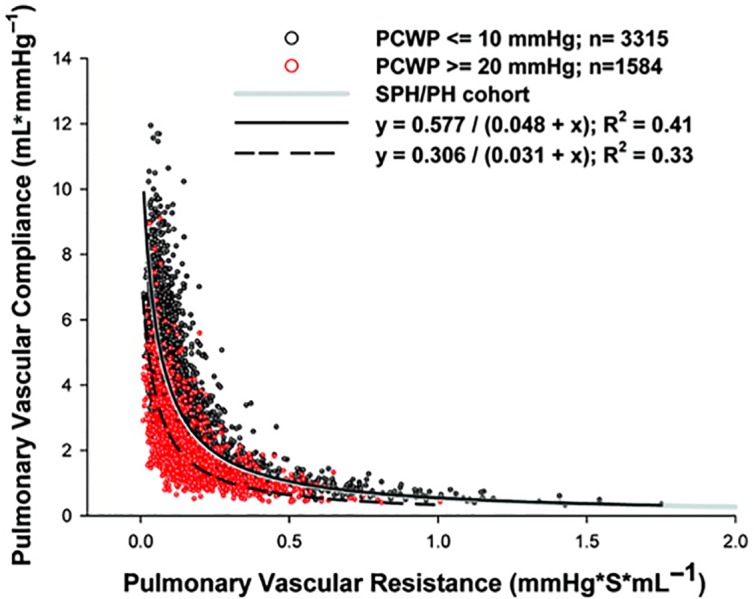
Figure 5.

In patients with elevated pulmonary capllary wedge pressure (red points) the relationship betwee PVR and PCa is shifted downward. Adapted from Ryan J. Tedford et al. Circulation. 2012;125289-297.

In patients with elevated pulmonary capllary wedge pressure (red points) the relationship betwee PVR and PCa is shifted downward. Adapted from Ryan J. Tedford et al. Circulation. 2012;125289-297.