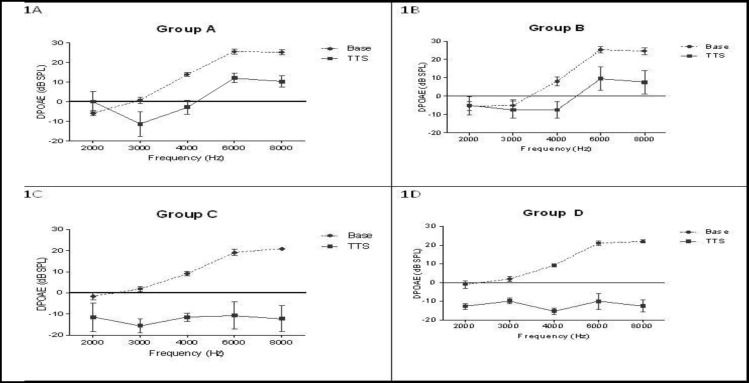
Fig1.
Comparison of distortion product otoacoustic emissions (DPOAE) amplitudes (mean ± SEM) measured at the start of the experiment (baseline amplitudes) (dotted lines) and 1 h after noise exposure (transient threshold shift: TTS) (solid lines) in four study groups (1A: group A, 1B: group B, 1C: group C, 1D: group D or control). Groups A, B, and C received 1250, 250, and 50 mg/kg/day of ascorbic acid, respectively. Transient threshold shift at 4–8 KHz was significantly lower for groups A and B

