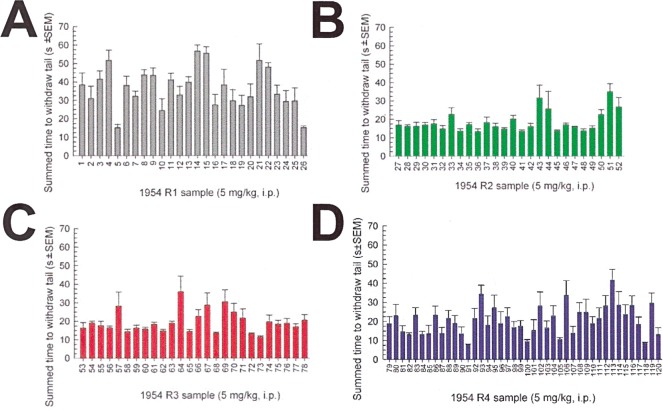
Figure 4.
Positional scan screening of 1954-series OXXX samples: summed antinociception produced by 1954 series samples measured in the mouse 55 °C warm water tail-withdrawal test across a 24-h period. (A) 1954 defined at position 1 (gray bars). (B) 1954 defined at position 2 (green bars). (C) 1954 defined at position 3 (red bars). (D) 1954 defined at position 4 (blue bars). The combined time to withdraw tails (s; y-axis) was calculated by taking the sum of the average tail-withdrawal latencies from each time point. Samples (x-axis; see Table 2 below for full identities of the various chosen for the individual compounds prepared) were administered at a dose of 5 mg/kg i.p. for testing. Functionalities of key samples are described in simplified form for convenience; see Table 1 for complete descriptions. Data represent average (±SEM) summed tail-withdrawal latencies calculated by taking the sum of the average tail-withdrawal latencies for each animal from each time point over a 24-h period. Samples administered at dose of 5 mg/kg, i.p. Bars = 8 mice each.

