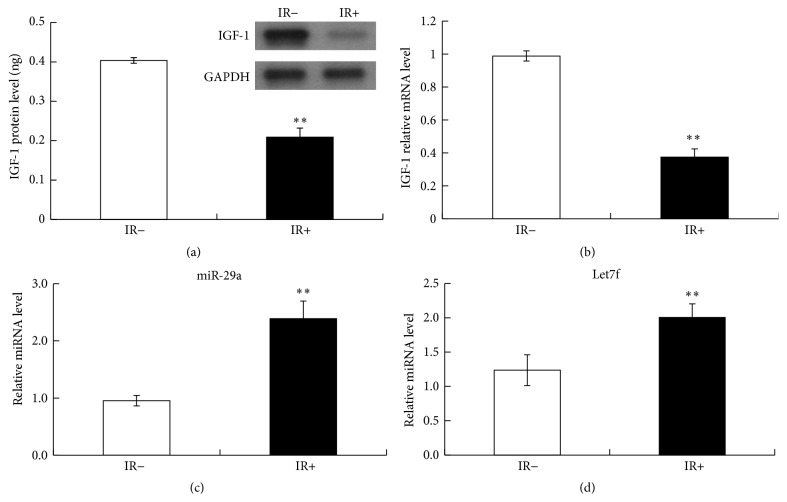
Figure 2.
IGF-1 expression decreased after ischemia-reperfusion. (a) IGF-1 protein expression in IR− and IR+ group (n = 10) measured by Elisa and Western blot. (b) Quantitative analysis of relative IGF-1 protein expression in IR− and IR+ group measured by RT-PCR. MiR-29a (c) and Let7f (d) expression increased after ischemia-reperfusion.

