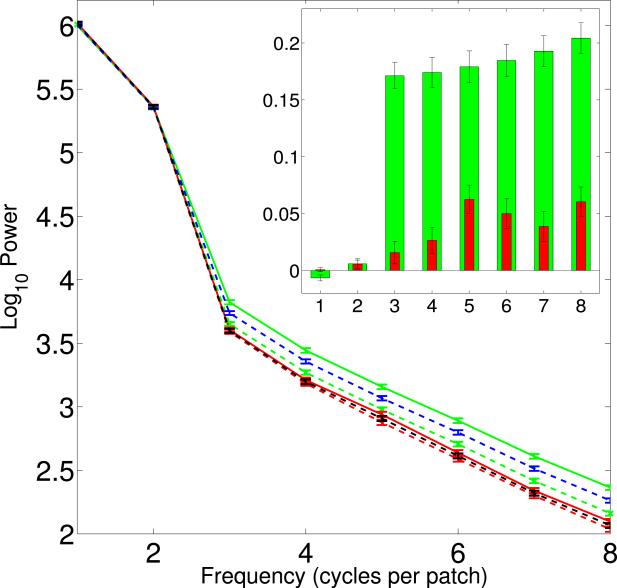
Figure 3.
Average power spectra of all patches of BSDS300 data as function of spatial frequency. The unoriented spectra are represented by dashed blue (figure) and black (ground) lines. The oriented spectra in the plot are: (solid green line), (dashed green line), (solid red line) and (dashed red line). Inset: The difference in power orthogonal and parallel to the OB () as function of spatial frequency. Axes are the same as in the main figure. Green and red bars represent figure (s = f) and ground (s = g) differences respectively. Error bars are standard errors in figure and inset. Significant differences are only observed for higher frequencies (bins 3-8), and they are significantly larger for the figure than for the ground side. Results from the LabelMe database are similar, see Appendix C.

