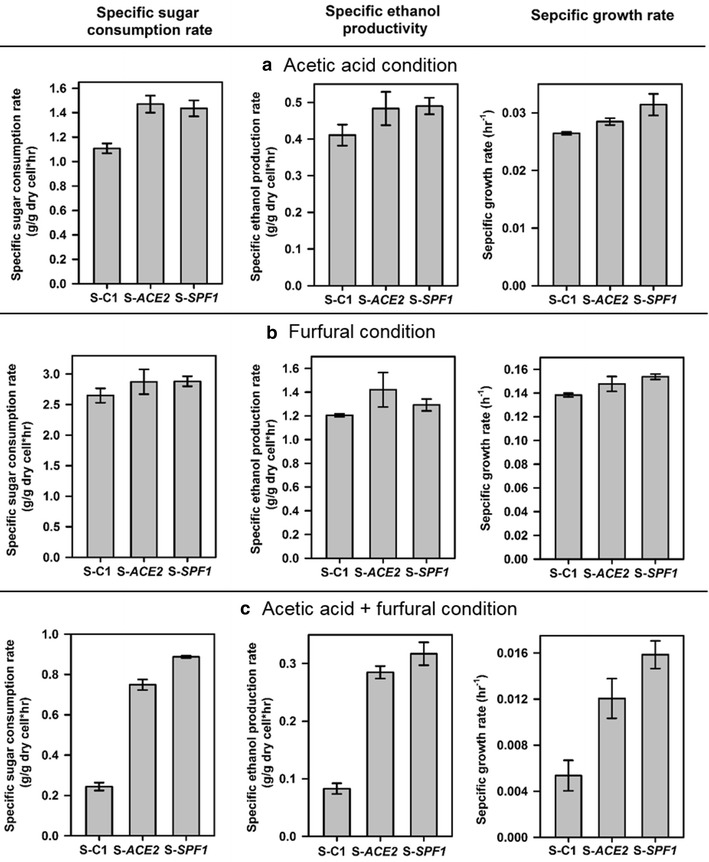
Fig. 5.

Fermentation performances of the strains S-ACE2, S-SFP1, and the control S-C1 under conditions with acetic acid (a), furfural (b), or acetic acid + furfural (c). Bars represent specific sugar consumption rates, specific ethanol productivities, and specific cell growth rates. Results were the means of duplicate experiments and error bars indicated standard deviations
