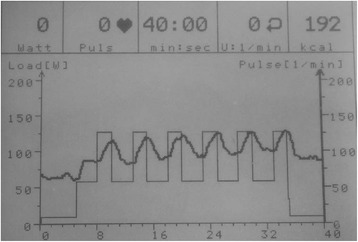
Fig. 3.

Screen shot of the display on the exercise ergometer at the end of a 40-minute exercise session. This shows power (W) and heart rate (beats.min-1) on the y-axis versus time (min) on the x-axis. The square wave pattern on the background is the preloaded exercise training programme. The sinusoidal pattern on the foreground is the variation in heart rate with the different training intensities recorded over time
