
Fig. 1.
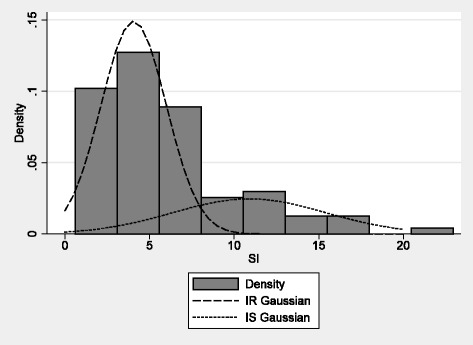
Gaussian distributions of insulin sensitivity values. Two groups [(insulin resistant (IR) and insulin sensitive (IS)] were identified based on the cut-point of 7.8
Official websites use .gov
A
.gov website belongs to an official
government organization in the United States.
Secure .gov websites use HTTPS
A lock (
) or https:// means you've safely
connected to the .gov website. Share sensitive
information only on official, secure websites.
Gaussian distributions of insulin sensitivity values. Two groups [(insulin resistant (IR) and insulin sensitive (IS)] were identified based on the cut-point of 7.8