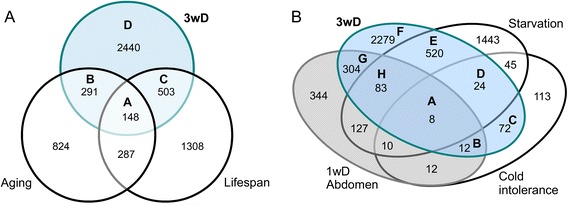
Fig. 10.

Venn diagrams comparing differentially regulated genes in genome-wide transcriptome studies of D. melanogaster. a Venn diagram comparing differentially regulated genes after 3 weeks of diapause (3wD, blue area; our study) with genes responding to aging [136] and a list of candidate genes affecting lifespan [135]. In Additional file 10: Figure S5 we show the results of Overrepresentation test of GO terms, performed in PANTHER for genes altered in dormancy in comparisons in groups A-D. b Comparisons with starvation, one-week diapause (abdomen) and cold tolerance. The blue area displays the number of differentially regulated genes after 3 weeks of diapause (3wD; our study). The grey area shows number of genes regulated in abdomens of flies after one week of diapause (1wD Abdomen) [140]. The other two sets contain genes regulated due to cold intolerance [141] and starvation [143]. In Additional file 11: Figure S6 we present a gene set enrichment analysis (GSEA) of Gene Ontology (GO) terms for comparisons among the four genome-wide transcription studies for each of the fields A-H in 10B
