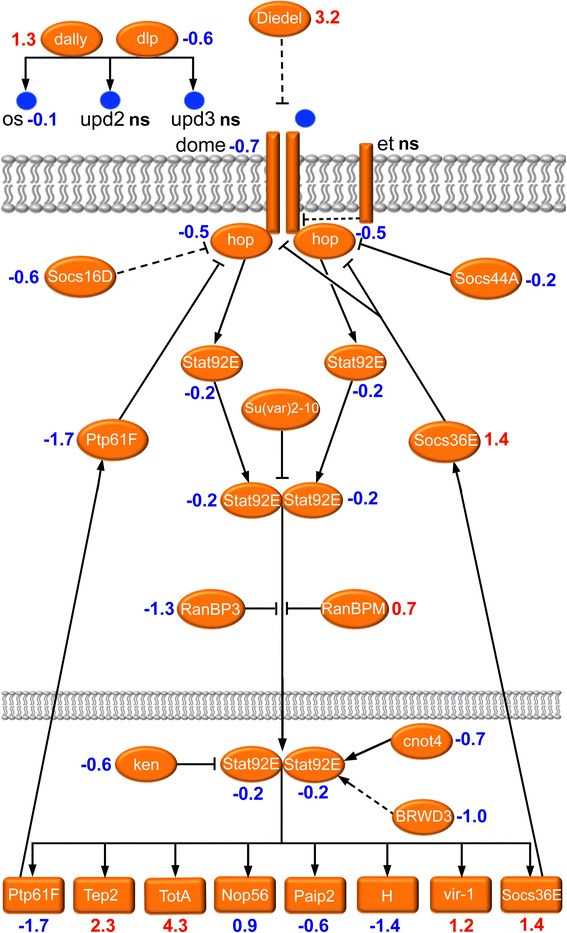
Fig. 5.

Altered gene expression in the JAK/STAT signaling pathway during diapause. This scheme displays a generalized assembly (regardless tissue specificity) of relevant genes in the JAK/STAT signal pathway. Transcript levels (logarithmic fold change, LogFC) are given in red for upregulated, blue for downregulated and black for no significant change (ns; LogFC close to 0). The acronyms are listed in Additional file 6: Table S3 where also references and details of gene/protein functions are given. At the whole organism level we observed a decreased expression of the core components of the JAK/STAT signaling and some read-out genes in diapausing flies. Some exceptions are seen in certain genes, involved in humoral immune response and stress resistance, which were upregulated (probably tissue-specific). The scheme is based partly on [172] and [80]. Further details are given in Additional file 6: Table S3 and text
