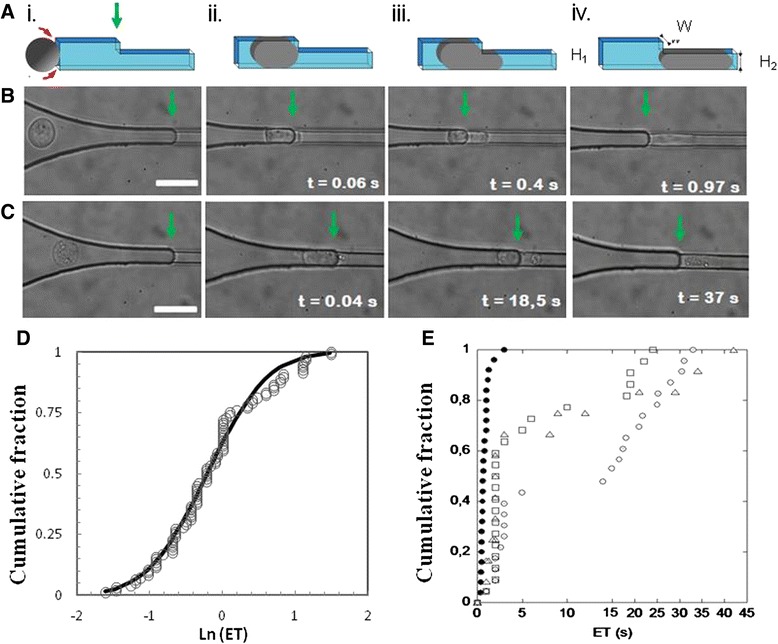
Fig. 1.

Microfluidic assay of leukocyte stiffness. a–c Leukocyte (THP-1) entering the microfluidic stiffness tester (a) represented on a schematic and (b) and (c) observed by video microscopy for a local suction pressure ΔP = 160 Pa, and after 1-h incubation with the serum (b) of a healthy volunteer and (c) of a patient with moderate to severe acute respiratory distress syndrome (ARDS). The green arrows indicate the entry of constriction C2. (i) Cell entering the funneled constriction C1, (ii) early cell contact with the entrance of constriction C2, (iii) the development of a cell projection in constriction C2, and (iv) completed entry in constriction C2. The scale bar represents 20 μm, the timing origin corresponds to first contact of the cell with entry of C2, and the entry time (ET) corresponds to the time for completed entry of a cell in C2 (see movie 1 in Additional file 2). d and e Cells stiffened by sera of patients with ARDS are distributed in two populations. Cumulative fraction of ET at ΔP = 160 Pa for THP-1 cells (d) incubated in serum of a healthy donor (filled circles) with a fit by a log-normal (Ln) distribution with μ = 0.8 and σ2 = 3.7 s2 (black line) and (e) incubated with the sera of three patients with moderate to severe ARDS (open symbols). All cells are stiffened and distributed in a bimodel population of moderately and highly stiffened cells. For each patient serum sample, the numbers of tested cells were 250 in (d) and 50 in (e)
