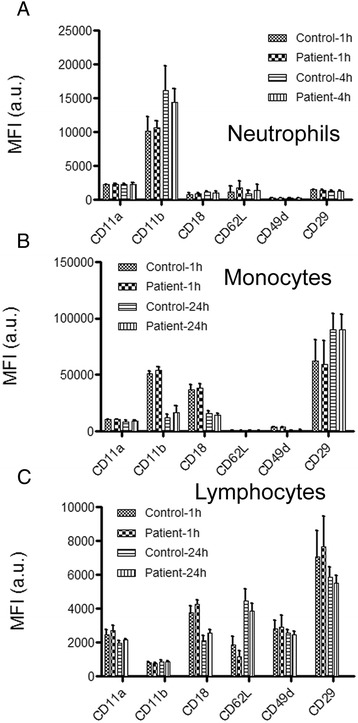
Fig. 6.

The expression of adhesion molecules. Cytometry data for human (a) primary neutrophils, (b) monocytes and (c) lymphocytes. The graph report the (MFI) for CD11a, CD11b, CD18, CD62L, CD49d, CD29 measured with healthy donors and ARDS patient samples at 1 and 4h for neutrophils, and at 1 and 24 h for monocytes and lymphocytes. The number of samples for healthy donors (n = 10) and patients with ARDS (n = 22). MFI values are the mean +/- SD. Mann-Whitney p-values are all > 0.05 between healthy donors and ARDS patients
