
Fig. 5.
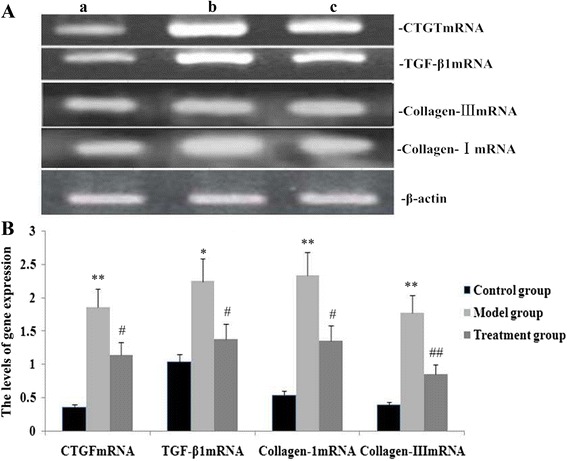
Effects of RPE treatment on gene expression of TGF-β1, CTGF, collagen III and collagen I in the lung. a Representative real-time PCR showing expression levels of TGF-β1, CTGF, collagen III and collagen I in mice on day 14 after the administration of RPE (a, control group; b, model group; c, treatment group). b Statistical summary of the 2^(−delta delta ct) analyses on mRNA expression in mice. Data are the means ± SD as determined from three independent experiments. *P < 0.05 and**P < 0.01 vs the control group; # P < 0.05 and # # P < 0.01 vs the model group