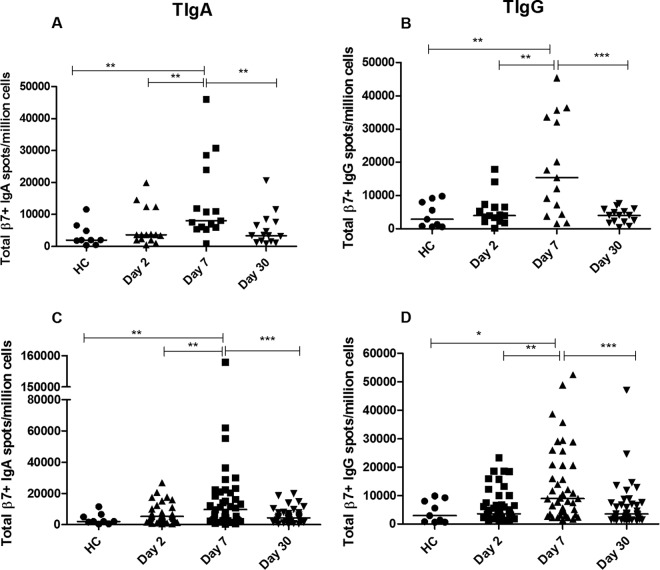
FIG 1.
Total gut-homing immunoglobulin-secreting cell (ISC) responses in V. cholerae O1-infected (A, B) and ETEC-infected (C, D) patients (on day 2, day 7, and day 30) compared to those in healthy controls (HC). Total IgA (A) and total IgG (B) ISCs in patients with cholera and total IgA (C) and total IgG (D) ISCs in patients with ETEC infection. Each symbol represents an individual data point for an individual patient, and the horizontal lines indicate the median responses for each study group. *, P < 0.05; **, P < 0.01; ***, P < 0.001. A P value of <0.05 was considered to be statistically significant.

