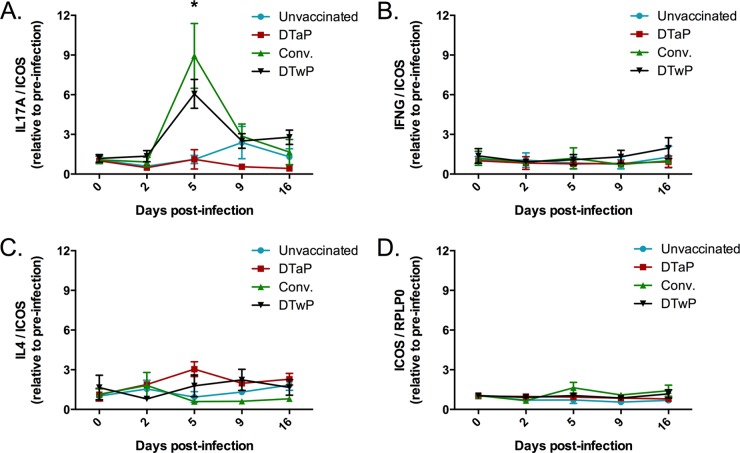
FIG 5.
Cytokine responses during infection. Blood was collected into PAXgene tubes to stabilize RNA at the indicated time points before and during the infection. RNA was converted to cDNA, and the transcript levels of the genes encoding IL-17A (A), IFN-γ (B), and IL-4 (C) were analyzed by real-time PCR. For each cytokine gene, the data are presented relative to ICOS transcript levels and are normalized to preinfection values. For each group, the mean response is presented with error bars representing the SE. (D) The ICOS transcript was similarly analyzed relative to the housekeeping gene RPLP0. For all graphs, n = 3 for unvaccinated and convalescent (Conv.), n = 2 for DTaP, n = 6 for DTwP. *, P ≤ 0.01 for convalescent versus unvaccinated and DTwP versus unvaccinated.

