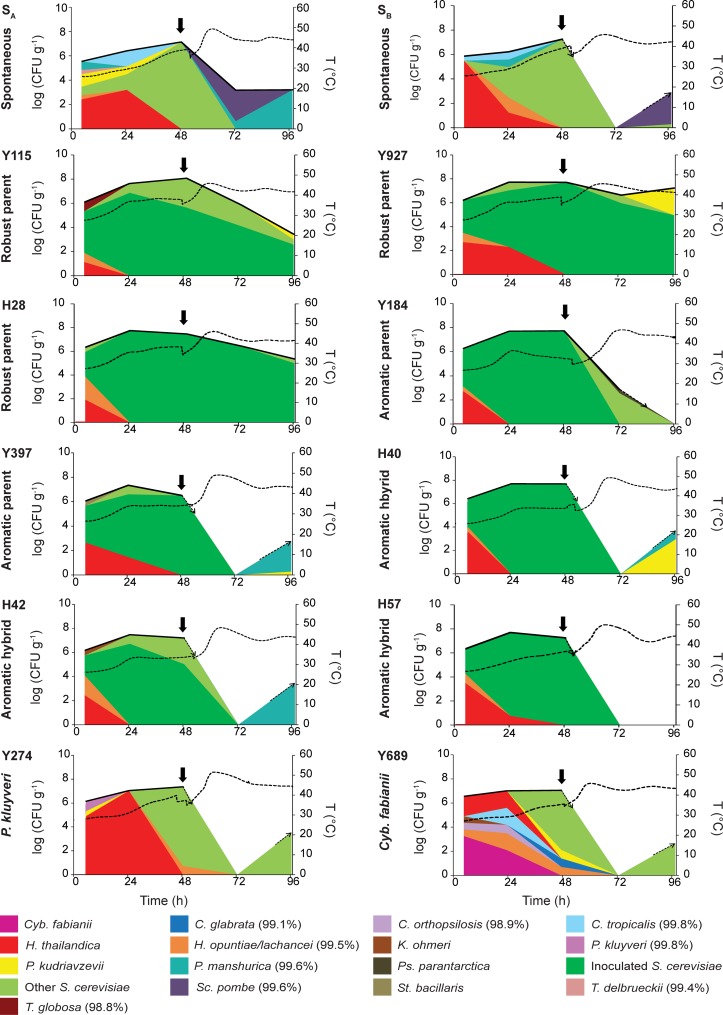
FIG 3.
Yeast populations in spontaneous and inoculated cocoa pulp pilot-scale fermentations. Two spontaneous fermentations (SA and SB, previously described in reference 29) and 20 inoculated fermentations (10 strains in duplicate; “A” replicates are shown here, and “B” replicates are shown in Fig. S3 in the supplemental material) were monitored (see Materials and Methods for details). Temperature (T) (right y axis) is indicated by a dashed black line. The dashed arrows indicate when the yeast cell count rises to or drops below the detection limit. Note that the scale for the total yeast count (left y axis) is logarithmic, whereas individual yeast species in the population at a given time point (indicated by the colors) are presented as a fraction of the total population. The absolute concentrations for individual species are given in Table S3 in the supplemental material. Percentages of identity are reported when there was <100% identity with type strain sequences (see Materials and Methods). Cocoa beans were turned after 48 h of fermentation (arrows). Cyb., Cyberlindnera; C., Candida; H., Hanseniaspora; K., Kodamaea; P., Pichia; Ps., Pseudozyma; S., Saccharomyces; Sc., Schizosaccharomyces; St., Starmerella; T., Torulaspora.

