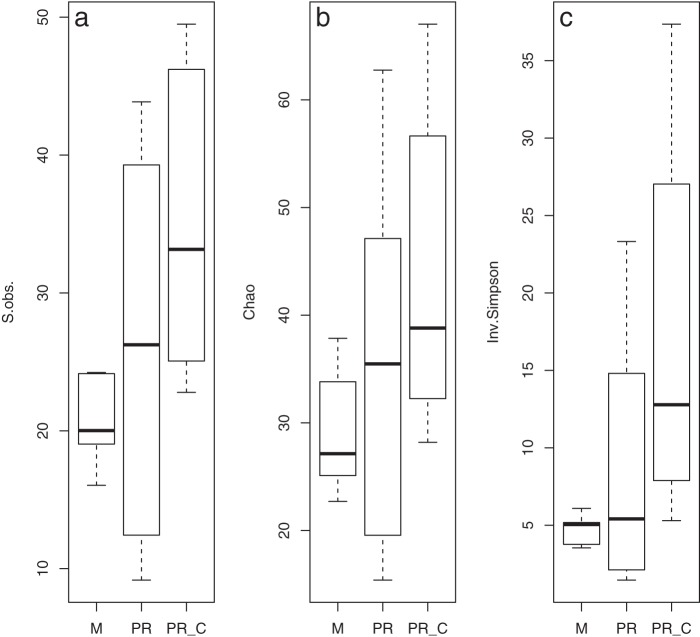
FIG 3.
Box plots for the number of OTUs observed (S.obs.) (a), the Chao1 richness estimator (b), and the inverse Simpson diversity index (Inv.Simpson) (c), calculated for an average of 1,000 subsamples of 143 sequences from each sample. Samples are grouped into Mexico infected (M), Puerto Rico infected (PR), and control (PR_C) groups.

