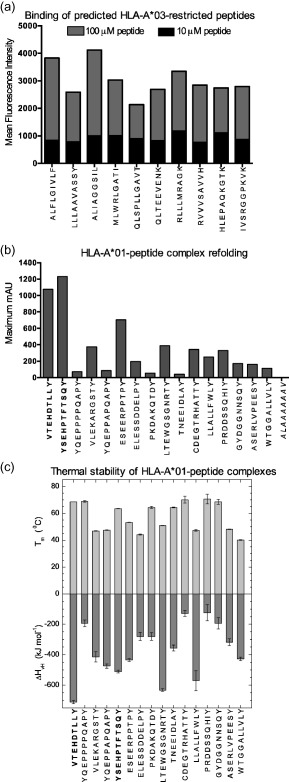
Figure 4.

Human leucocyte antigen (HLA) class I peptide binding assays for algorithm‐predicted peptides. (a) HLA‐A*03 binding of predicted peptides was confirmed using a T2 cell line transfected with HLA‐A*03. Peptides were added at concentrations of 10 μM or 100 μM, and HLA class I expression was measured by flow cytometry analysis using an αHLA‐A*03 antibody. Data are shown as the mean fluorescence intensity above the negative control. (b) HLA‐A*01 binding of predicted peptides was confirmed by in‐vitro refolding. Maximum mAU values are shown. Positive control peptides are in shown in bold type. The negative control peptide is shown in italics. (c) Thermal stability with respect to melting temperature (upper panel) and van't Hoff's enthalpy of unfolding (lower panel). Error bars represent standard error of the respective parameter based on fitting each set of measured data. Positive control peptides are shown in bold type.
