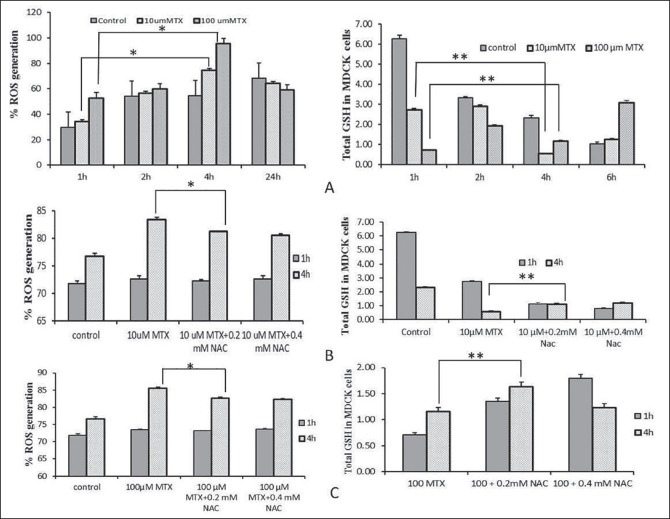
Figure 2.
Percent changed of reactive oxygen species generation in Madin-Darby canine kidney cell line; (a) Percent of reactive oxygen species generation and total glutathione generation (nmoles) in Madin-Darby canine kidney cells after treatment with 10 or 100 μM methotrexate; (b) Percent of reactive oxygen species generation and total glutathione generation (nmoles) in Madin-Darby canine kidney cells at 1 and 4 h after co-treatment with 10 μM methotrexate alone and in combination with 0.2 and 0.4 mM N-acetylcysteine; (c) Percent of reactive oxygen species and total glutathione generation (nmol) in Madin-Darby canine kidney cells at 1 and 4 after co-treatment with 100 μM methotrexate alone and in combination with 0.2 and 0.4 mM N-acetylcysteine. *P > 0.05, **P > 0.001

