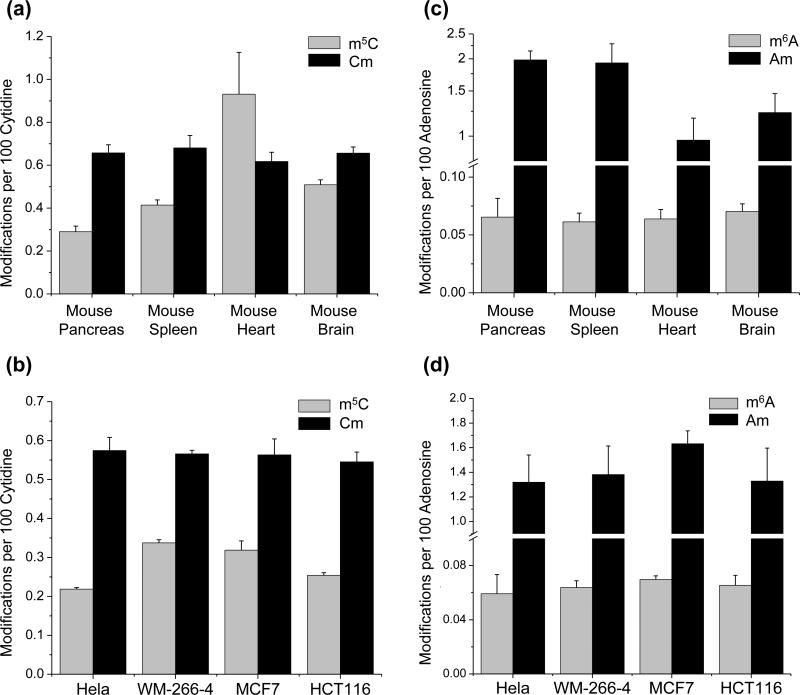
Figure 2.
Quantification results for the levels of m5C and Cm (a), m6A and Am (c) in mouse tissues (n≥3). The tissue types include mouse pancreas, spleen, heart, and brain. Quantification results for the levels of m5C and Cm (b), m6A and Am (d) in cultured human cancer cells (n=3). The data represent the means and standard deviations of results from at least three separate mouse tissues or 3 individual RNA samples extracted from cultured human cells.

