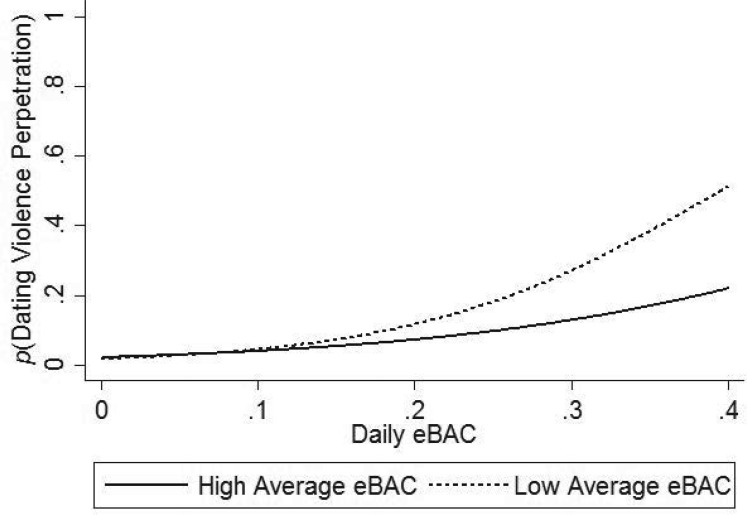
Figure 1.
Predicted probability of dating violence perpetration as a function of daily estimated blood alcohol concentration (eBAC) and average eBAC from Model 3. To show estimates for specific eBAC values rather than for deviations from person-mean levels, estimates are displayed for probabilities at the average of person-mean eBAC. Average eBAC is plotted at 1 SD above (i.e., high average eBAC) and below (i.e., low average eBAC) the mean.

