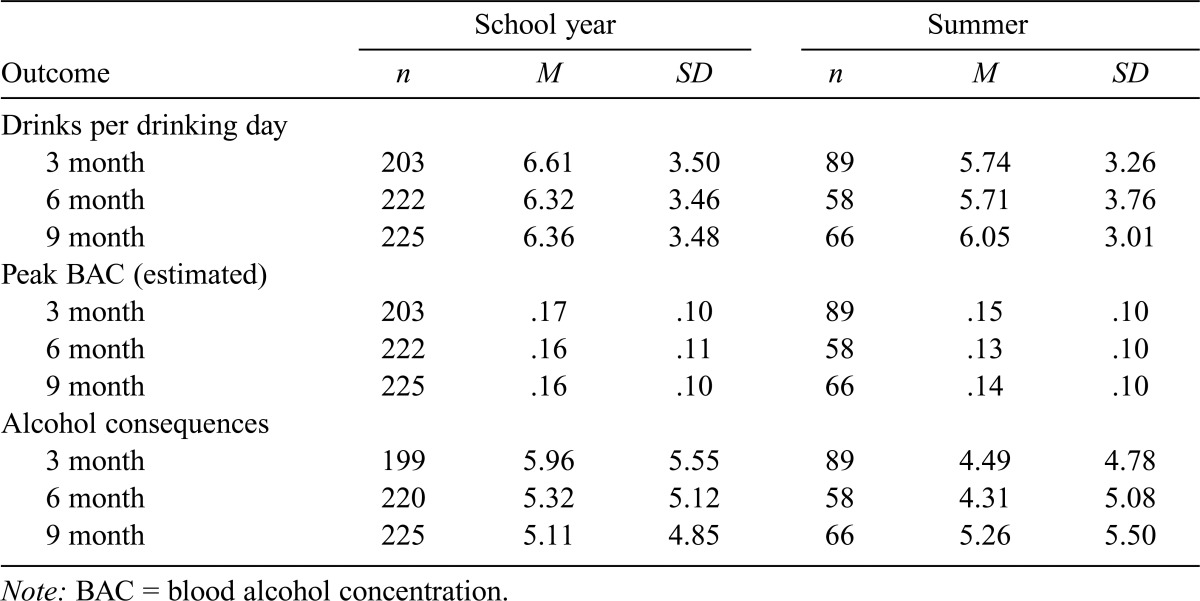
Table 1.
Descriptive statistics for outcomes across school-year and summer assessments
| School year |
Summer |
|||||
| Outcome | n | M | SD | n | M | SD |
| Drinks per drinking day | ||||||
| 3 month | 203 | 6.61 | 3.50 | 89 | 5.74 | 3.26 |
| 6 month | 222 | 6.32 | 3.46 | 58 | 5.71 | 3.76 |
| 9 month | 225 | 6.36 | 3.48 | 66 | 6.05 | 3.01 |
| Peak BAC (estimated) | ||||||
| 3 month | 203 | .17 | .10 | 89 | .15 | .10 |
| 6 month | 222 | .16 | .11 | 58 | .13 | .10 |
| 9 month | 225 | .16 | .10 | 66 | .14 | .10 |
| Alcohol consequences | ||||||
| 3 month | 199 | 5.96 | 5.55 | 89 | 4.49 | 4.78 |
| 6 month | 220 | 5.32 | 5.12 | 58 | 4.31 | 5.08 |
| 9 month | 225 | 5.11 | 4.85 | 66 | 5.26 | 5.50 |
Note: BAC = blood alcohol concentration.

