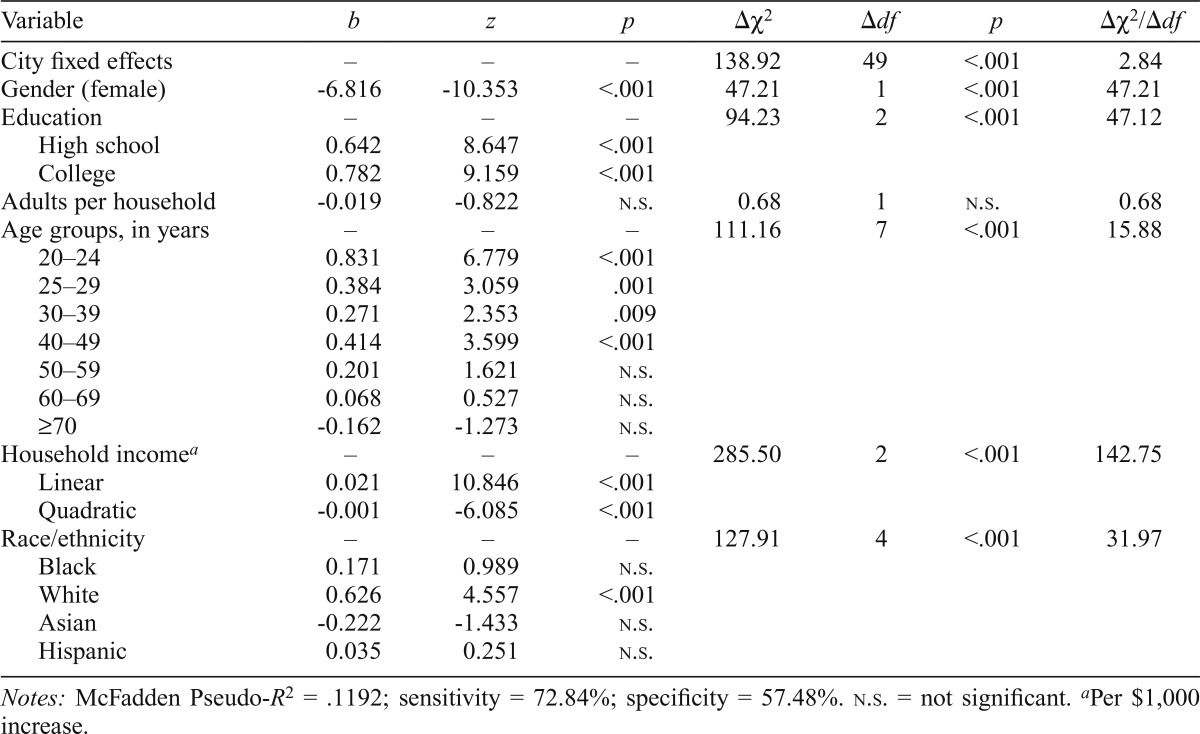
Table 1.
Logistic regression analysis of past year drinking status (use vs. abstention) among individual survey respondents (n = 8,790)
| Variable | b | z | p | Δχ2 | Δdf | p | Δχ2/Δdf |
| City fixed effects | – | – | – | 138.92 | 49 | <.001 | 2.84 |
| Gender (female) | -6.816 | -10.353 | <.001 | 47.21 | 1 | <.001 | 47.21 |
| Education | – | – | – | 94.23 | 2 | <.001 | 47.12 |
| High school | 0.642 | 8.647 | <.001 | ||||
| College | 0.782 | 9.159 | <.001 | ||||
| Adults per household | -0.019 | -0.822 | n.s. | 0.68 | 1 | n.s. | 0.68 |
| Age groups, in years | – | – | – | 111.16 | 7 | <.001 | 15.88 |
| 20–24 | 0.831 | 6.779 | <.001 | ||||
| 25–29 | 0.384 | 3.059 | .001 | ||||
| 30–39 | 0.271 | 2.353 | .009 | ||||
| 40–49 | 0.414 | 3.599 | <.001 | ||||
| 50–59 | 0.201 | 1.621 | n.s. | ||||
| 60–69 | 0.068 | 0.527 | n.s. | ||||
| ≥70 | -0.162 | -1.273 | n.s. | ||||
| Household incomea | – | – | – | 285.50 | 2 | <.001 | 142.75 |
| Linear | 0.021 | 10.846 | <.001 | ||||
| Quadratic | -0.001 | -6.085 | <.001 | ||||
| Race/ethnicity | – | – | – | 127.91 | 4 | <.001 | 31.97 |
| Black | 0.171 | 0.989 | n.s. | ||||
| White | 0.626 | 4.557 | <.001 | ||||
| Asian | -0.222 | -1.433 | n.s. | ||||
| Hispanic | 0.035 | 0.251 | n.s. |
Notes: McFadden Pseudo-R2 = .1192; sensitivity = 72.84%; specificity = 57.48%. n.s. = not significant.
Per $1,000 increase.

