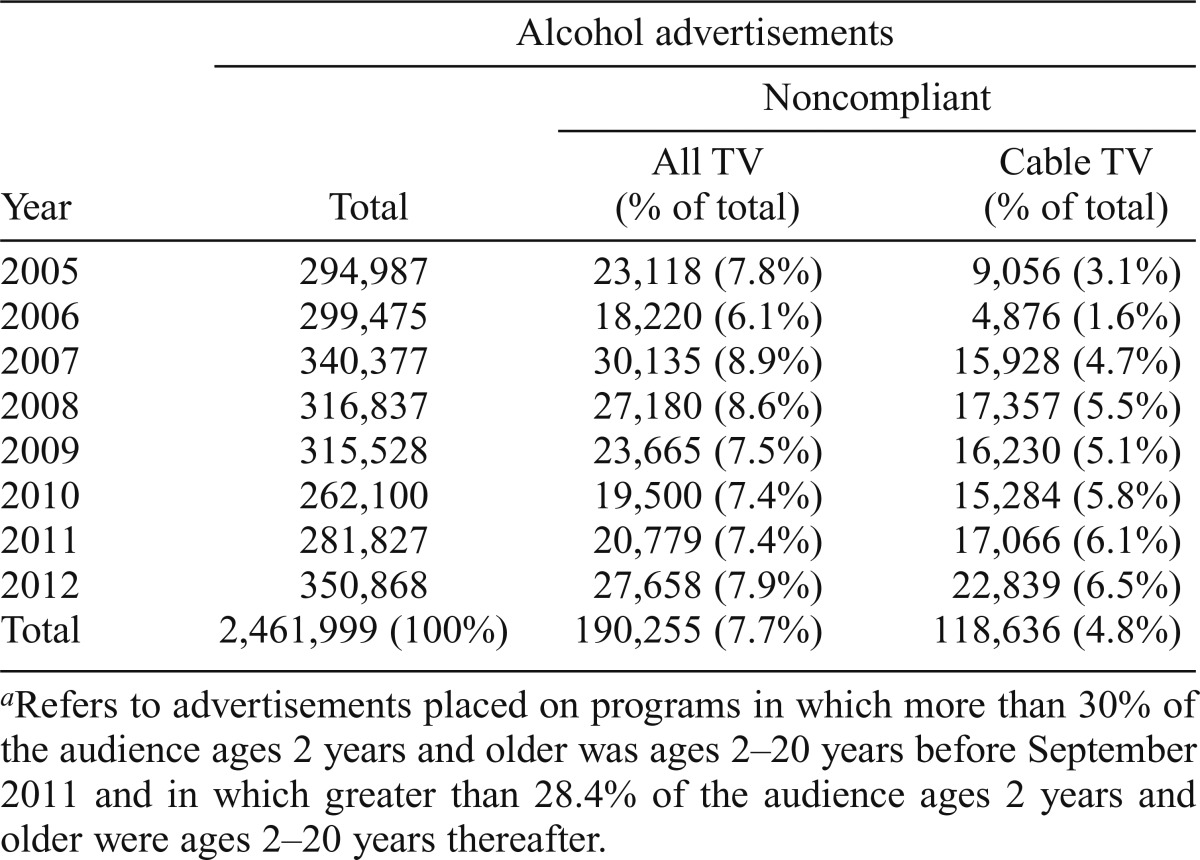
Table 1.
Total and noncompliant alcohol advertisementsa by television media type and year, 2005–2012
| Alcohol advertisements |
|||
| Noncompliant |
|||
| Year | Total | All TV (% of total) | Cable TV (% of total) |
| 2005 | 294,987 | 23,118 (7.8%) | 9,056 (3.1%) |
| 2006 | 299,475 | 18,220 (6.1%) | 4,876 (1.6%) |
| 2007 | 340,377 | 30,135 (8.9%) | 15,928 (4.7%) |
| 2008 | 316,837 | 27,180 (8.6%) | 17,357 (5.5%) |
| 2009 | 315,528 | 23,665 (7.5%) | 16,230 (5.1%) |
| 2010 | 262,100 | 19,500 (7.4%) | 15,284 (5.8%) |
| 2011 | 281,827 | 20,779 (7.4%) | 17,066 (6.1%) |
| 2012 | 350,868 | 27,658 (7.9%) | 22,839 (6.5%) |
| Total | 2,461,999 (100%) | 190,255 (7.7%) | 118,636 (4.8%) |
Refers to advertisements placed on programs in which more than 30% of the audience ages 2 years and older was ages 2–20 years before September 2011 and in which greater than 28.4% of the audience ages 2 years and older were ages 2–20 years thereafter.

