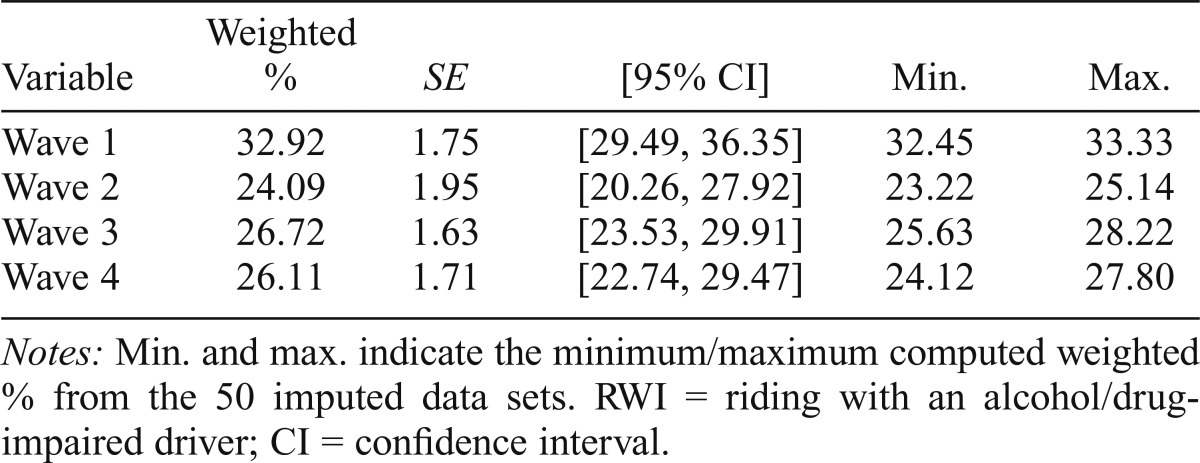
Table 1.
Percentages of RWI at least once in past year at Waves 1 to 4 (n = 2,659)
| Variable | Weighted % | SE | [95% CI] | Min. | Max. |
| Wave 1 | 32.92 | 1.75 | [29.49, 36.35] | 32.45 | 33.33 |
| Wave 2 | 24.09 | 1.95 | [20.26, 27.92] | 23.22 | 25.14 |
| Wave 3 | 26.72 | 1.63 | [23.53, 29.91] | 25.63 | 28.22 |
| Wave 4 | 26.11 | 1.71 | [22.74, 29.47] | 24.12 | 27.80 |
Notes: Min. and max. indicate the minimum/maximum computed weighted % from the 50 imputed data sets. RWI = riding with an alcohol/drug-impaired driver; CI = confidence interval.

