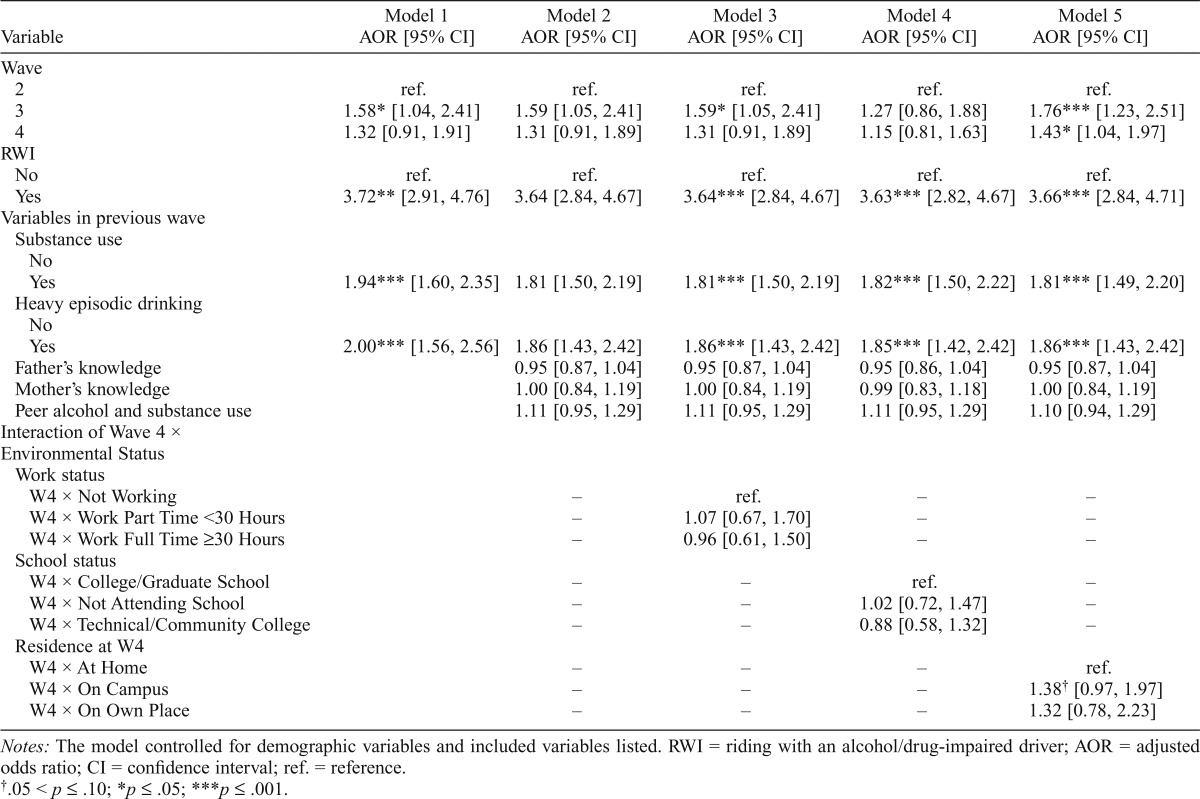
Table 4.
Transition models of RWI: Multivariate association between RWI and previous wave predictors
| Variable | Model 1 AOR [95% CI] | Model 2 AOR [95% CI] | Model 3 AOR [95% CI] | Model 4 AOR [95% CI] | Model 5 AOR [95% CI] |
| Wave | |||||
| 2 | ref. | ref. | ref. | ref. | ref. |
| 3 | 1.58* [1.04, 2.41] | 1.59 [1.05, 2.41] | 1.59* [1.05, 2.41] | 1.27 [0.86, 1.88] | 1.76*** [1.23, 2.51] |
| 4 | 1.32 [0.91, 1.91] | 1.31 [0.91, 1.89] | 1.31 [0.91, 1.89] | 1.15 [0.81, 1.63] | 1.43* [1.04, 1.97] |
| RWI | |||||
| No | ref. | ref. | ref. | ref. | ref. |
| Yes | 3.72** [2.91, 4.76] | 3.64 [2.84, 4.67] | 3.64*** [2.84, 4.67] | 3.63*** [2.82, 4.67] | 3.66*** [2.84, 4.71] |
| Variables in previous wave | |||||
| Substance use | |||||
| No | |||||
| Yes | 1.94*** [1.60, 2.35] | 1.81 [1.50, 2.19] | 1.81*** [1.50, 2.19] | 1.82*** [1.50, 2.22] | 1.81*** [1.49, 2.20] |
| Heavy episodic drinking | |||||
| No | |||||
| Yes | 2.00*** [1.56, 2.56] | 1.86 [1.43, 2.42] | 1.86*** [1.43, 2.42] | 1.85*** [1.42, 2.42] | 1.86*** [1.43, 2.42] |
| Father’s knowledge | 0.95 [0.87, 1.04] | 0.95 [0.87, 1.04] | 0.95 [0.86, 1.04] | 0.95 [0.87, 1.04] | |
| Mother’s knowledge | 1.00 [0.84, 1.19] | 1.00 [0.84, 1.19] | 0.99 [0.83, 1.18] | 1.00 [0.84, 1.19] | |
| Peer alcohol and substance use | 1.11 [0.95, 1.29] | 1.11 [0.95, 1.29] | 1.11 [0.95, 1.29] | 1.10 [0.94, 1.29] | |
| Interaction of Wave 4 × Environmental Status | |||||
| Work status | |||||
| W4 × Not Working | – | ref. | – | – | |
| W4 × Work Part Time <30 Hours | – | 1.07 [0.67, 1.70] | – | – | |
| W4 × Work Full Time >30 Hours | – | 0.96 [0.61, 1.50] | – | – | |
| School status | |||||
| W4 × College/Graduate School | ref. | ||||
| W4 × Not Attending School | – | – | 1.02 [0.72, 1.47] | – | |
| W4 × Technical/Community College | – | – | 0.88 [0.58, 1.32] | – | |
| Residence at W4 | |||||
| W4 × At Home | – | – | – | ref. | |
| W4 × On Campus | – | – | – | 1.38† [0.97, 1.97] | |
| W4 × On Own Place | – | – | – | 1.32 [0.78, 2.23] |
Notes: The model controlled for demographic variables and included variables listed. RWI = riding with an alcohol/drug-impaired driver; AOR = adjusted odds ratio; CI = confidence interval; ref. = reference.
.05 <p ≤ .10;
p ≤ .05;
p ≤ .001.

