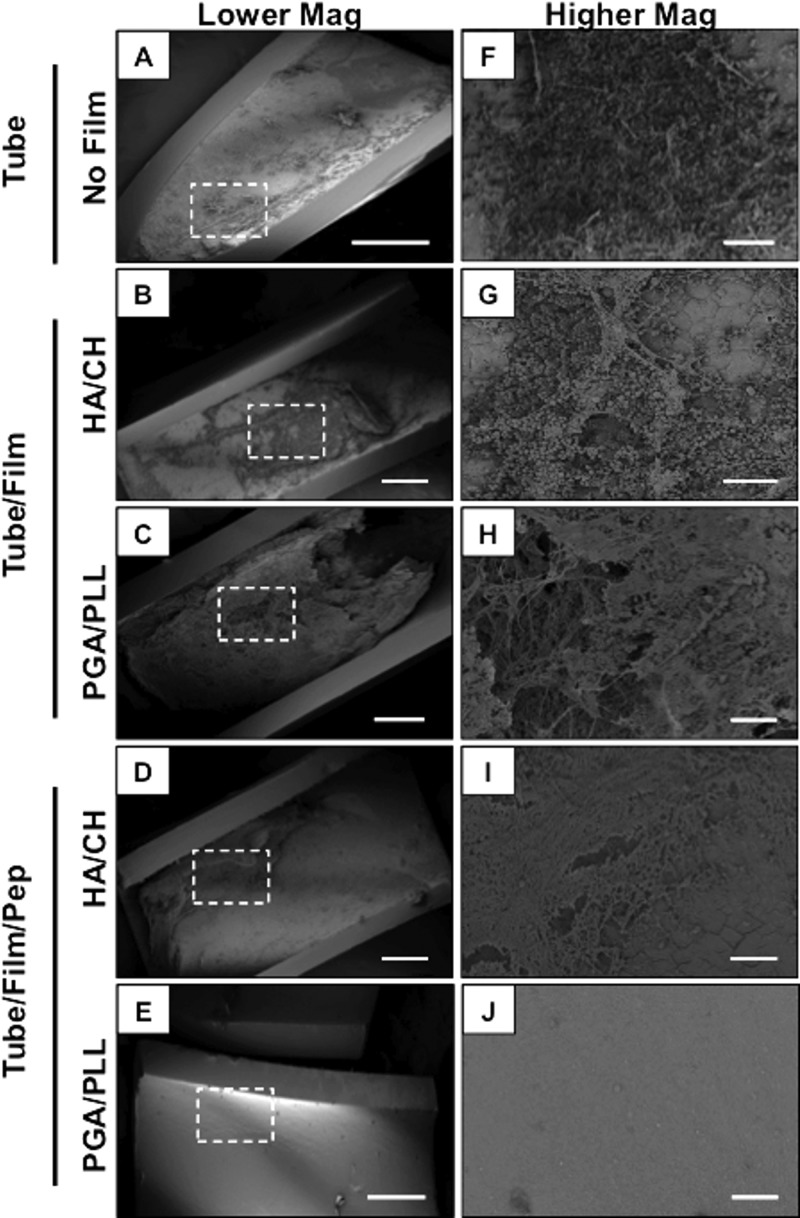
Figure 7.
(A–E) Low- and (F–J) high-magnification scanning electron microscopy images showing biofilm formed in vivo on the inner surfaces of catheters using a rat central venous catheter biofilm model (catheter tubes were longitudinally sliced prior to imaging; see text for additional details). Images show the surfaces of: (A, F) an untreated control tube (tube; no film, no peptide); (B, G) a tube coated with a HA/CH film 19.5 bilayers thick (tube/film; no peptide); (C, H) a tube coated with a PGA/PLL film 19.5 bilayers thick (tube/film; no peptide); (D, I) a tube coated with a HA/CH film and loaded with β-peptide (tube/film/pep); and (E, J) a tube coated with a PGA/PLL film and loaded with β-peptide (tube/film/pep) after insertion into the jugular vein and incubation with a C. albicans inoculum. The white dotted boxes in A–E indicate the approximate region from which the corresponding higher magnification images in F-J were obtained. Scale bars = (A–E) 400 μm and (F–J) 40 μm.

