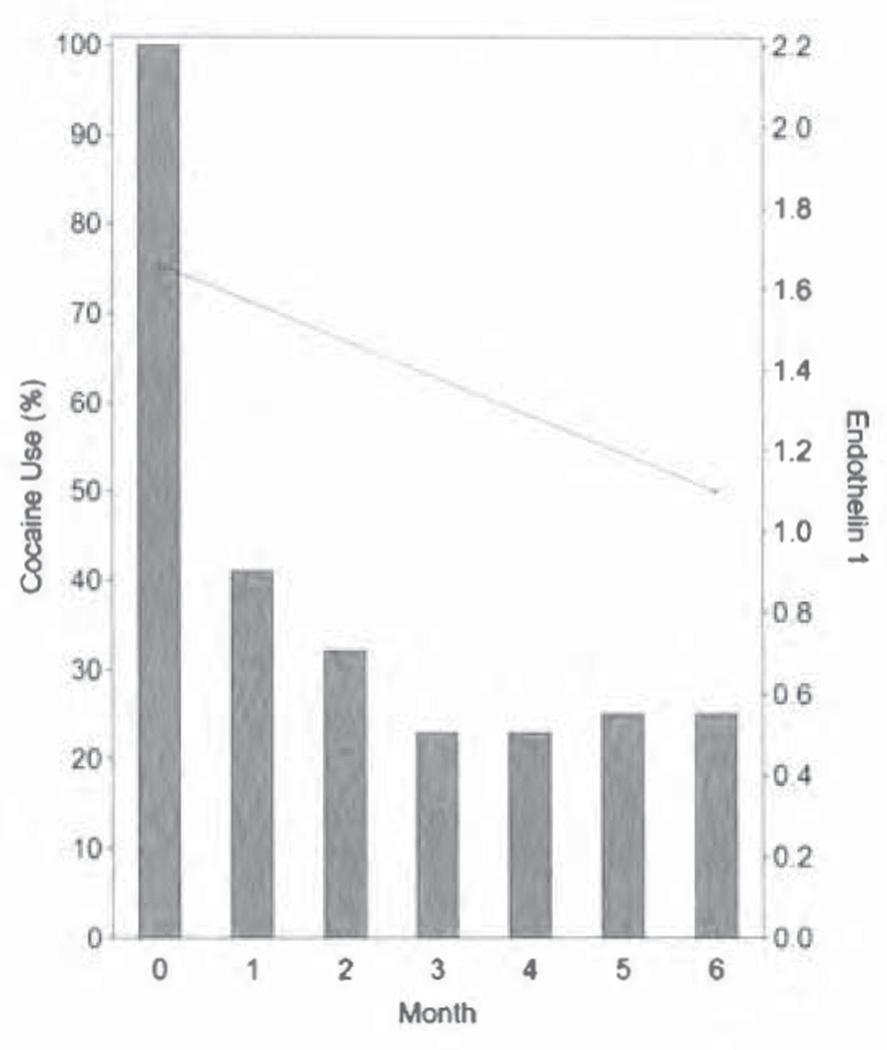
FIGURE 1.
Proportions of study participants using cocaine in the 6-month period and the median ET-1 levels (pg/mL) at baseline and 6-month follow-up. Both the proportions of study participants who were using cocaine in the 6-month period and the median ET-1 levels at baseline and 6-month follow-up are presented in this figure. The proportions of study participants using cocaine are plotted using the y axis on the left side of the figure, whereas the median ET-1 levels at baseline and 6-month follow-up are presented using the y axis on the right side of the figure. The ET-1 at baseline was significantly higher than that at 6-month follow-up (P < 0.0001). ET-1 indicates endothelin-1.

