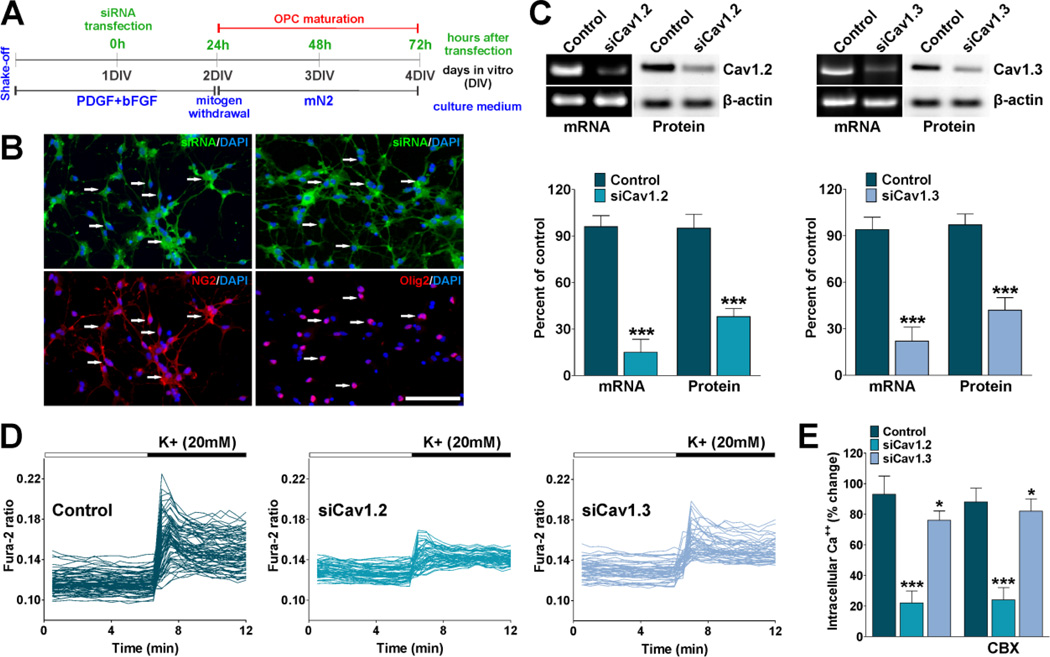
FIGURE 2. siRNA knockdown of L-type VOCCs in OPCs.
(A) One day after plating, OPCs were transfected with a combination of three different siRNA duplexes specific for Cav1.2 and Cav1.3 (siCav1.2/1.3). After transfection OPCs were further cultured for 24h in defined culture media plus PDGF and bFGF and then induced to exit from the cell cycle and differentiate by switching the cells to a mitogen-free medium (mN2). (B) OPCs were treated with fluorescein-labeled dsRNA oligomers to determine siRNA transfection efficiency. 24h after transfection the cells were stained with antibodies against NG2 and Olig2. Scale bar = 80µm. (C) 72h after siRNA transfection semi-quantitative RT-PCR and western blot analysis of Cav1.2 and Cav1.3 expression in OPCs was performed using β-actin as internal standard. Data from three independent experiments are summarized based on the relative spot intensities and plotted as percent of controls. (D) 72h after siRNA transfection VOCC activity was examined in cultured OPCs using Fura-2 as intracellular Ca++ indicator. Note that each trace corresponds to a single cell and the horizontal bars indicate the time of addition of external solution containing high K+. (E) The bar graph shows the average amplitude of the Ca++ response, calculated from the responding cells expressed as a percentage of change of the emission intensities. The same experiment was performed in the presence of carbenoxolone (200µM) (CBX). Values are expressed as mean ± SEM of at least six independent experiments. *p<0.05, ***p<0.001 vs. control.

