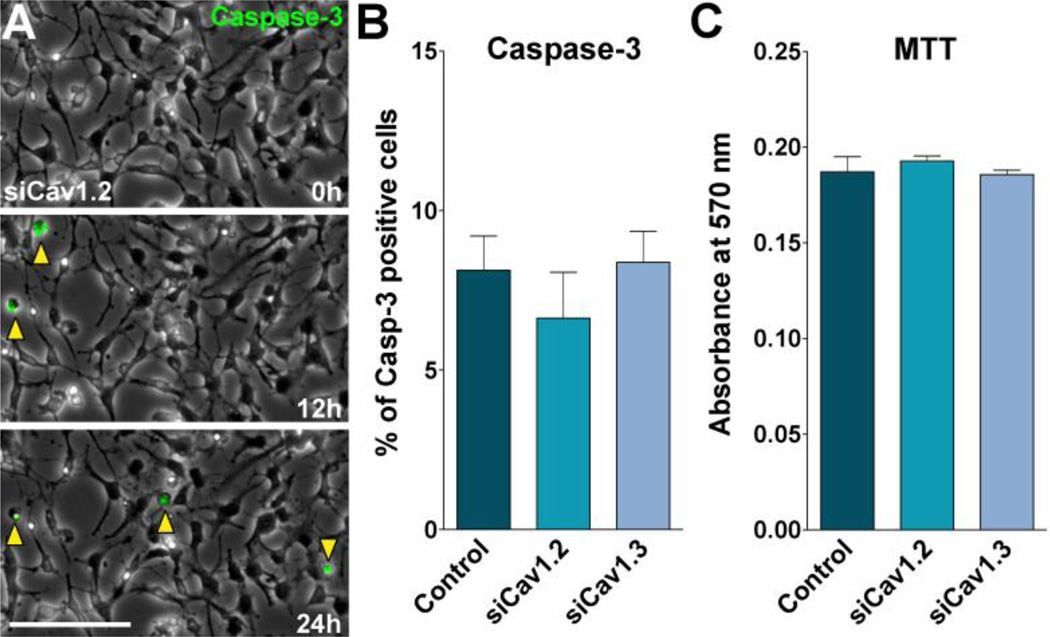
FIGURE 7. OPC viability after L-type VOCC knockdown.
OPCs were transfected with siRNA duplexes specific for Cav1.2 and Cav1.3 (siCav1.2/1.3) and grown as described in Figure 2. (A) Real-time Caspase-3 assay, using NucView 488 Caspase-3 substrate, was performed as described in Materials and Methods. Fluorescent field images were obtained with a specific GFP filter at 6min intervals for a period of 24h beginning 48h after siRNA transfection. Bright field images were superimposed to show the cell morphology. Yellow arrowheads designate some apoptotic OPCs (Caspase-3+ cells). Time is denoted in hours in the bottom right corner. Scale bar = 60µm. (B) OPCs death were evaluated by measuring the percentage of Caspase-3+ cells in each experimental group for a period of 24h. (C) Evaluation of OPCs viability by the MTT assay 48h after siRNA transfection. Values are expressed as mean ± SEM of five independent experiments.

